Ok everyone I never got around to doing a full on Analog study for this winter BUT I have thrown together some stuff for us to look at today.
I haven't critiqued this as hardcore as I normally would so I'd say the room for error is on the higher side than normal, BUT this seems to be a generally good group of analogs.
First up here is a comparison of the SST average of the analogs to the last 30 days of SST. Surprisingly this group turned out to be very close to the current SST map. So we can be confident in our SST comparison. The DJF period for these analogs is a moderate Nina. Its actually a very similar global state to the current SST.
View attachment 90821
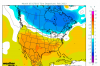
I'll spare us all the individual years and stuff. Here are the temp and 500mb analogs for DJF.
These analogs also roughly align with this years June-August temp profile. Although not perfect It is close enough IMO to consider them a good analog based off temp data.
You can see we follow a pretty classic winter pattern for the Eastern US. Mixed signal December but a cold January followed by cold Central US for February. These years all feature at least one -nao month in winter and most of them have more than that. So that similarity to last year should hold true this winter.
View attachment 90822View attachment 90827View attachment 90826View attachment 90824
No surprise our precipitation follows the standard La Nina pattern here.
View attachment 90825
One Curve Ball
These analogs have two years with extremely low hurricane ace. This doesn't seem to impact our January or February but it has some pretty serious impacts to our December when we take those two out. I'm not sure how much weight to give this so I didn't change my analog group based off it but there is a correlation in this group for high ace and a cold December. Is this just a coincidence?
View attachment 90823
And finally here are the snowfall anomalies for these years. One thing that stands out is the fact that nearly every analog features a single "big dog" across the Southern US. It seems like these analogs indicate an increased chance of a large legit southern snow storm this year.
View attachment 90828View attachment 90829
Overall I would say chances are we have a normal December, Cold January, normal to AN February with an increased chance of a widespread southern storm likely in January. This also generally matches up well with the thinking that a repeat Nina typically repeats the overall pattern of the previous one although on a muted scale. Like I said I didn't deep dive into this too much so take it for what its worth! I'm rooting for you southern guys this winter