Dawgdaze22
Member
Just get ready for severe weather at this point.
Yeah seeing suppressed and within 7 days gives me false hope....... again lolGFS looks similar to the icon with the day 7 threat potential. Ukmet looks like it's setting up similar at hr 144. Maybe an outside chance materializing.
What was rdus total the previous 4?Raleigh has had roughly 3" of snow total the past 4 winters. This is the worst 4 yr stretch since 2005-2008...the worst 5 yr stretch has been roughly 9.5" total. So to even meet that futitlity we would need 6-7" next winter...that seems insurmountable.
I wonder what the total was for the 5 year stretch from 2000-2004 in Raleigh. That seemed to be an active period.Raleigh has had roughly 3" of snow total the past 4 winters. This is the worst 4 yr stretch since 2005-2008...the worst 5 yr stretch has been roughly 9.5" total. So to even meet that futitlity we would need 6-7" next winter...that seems insurmountable.
62" but we had 3 double digit seasons. That stretch will probably never be duplicated again.I wonder what the total was for the 5 year stretch from 2000-2004 in Raleigh. That seemed to be an active period.
I think RDU has 4-5” or so last year and a couple inches in the February 2020 slushstorm. I think we had 0.5-1” in the 2020-2021 disastrous winter, too. I suspect the 1990s probably had a worse stretch.Raleigh has had roughly 3" of snow total the past 4 winters. This is the worst 4 yr stretch since 2005-2008...the worst 5 yr stretch has been roughly 9.5" total. So to even meet that futitlity we would need 6-7" next winter...that seems insurmountable.
1990-92 did not feature much winter precip outside of the mountains. 1 small snowstorm along I-20 in 1992 and an icestorm in some of the area just after Christmas 1992. 1996-97 and 1997-98 were not too good either for most of us.I think RDU has 4-5” or so last year and a couple inches in the February 2020 slushstorm. I think we had 0.5-1” in the 2020-2021 disastrous winter, too. I suspect the 1990s probably had a worse stretch.
That’s a lot of pink and white 2 states N of you! ?This is for Sunday afternoon into the evening On the 12z Gfs. Taken with a huge grain of salt of course because everyday that goes by its less and less likely we get snow. A late season Hail Mary would be nice though!
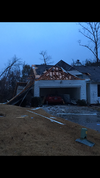
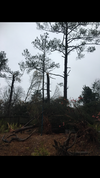
View attachment 134031View attachment 134032
No thanks, I’ve had enough already
View attachment 134034View attachment 134035View attachment 134036
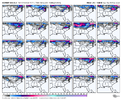
EPS snow depth showing a little noise for the weekend for NE NC, anybody ahem @KyloG lol got maps. I'm desperate, is it one member or a few small members or nothing at all?
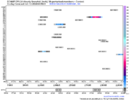
EPS snow depth showing a little noise for the weekend for NE NC, anybody ahem @KyloG lol got maps. I'm desperate, is it one member or a few small members or nothing at all?
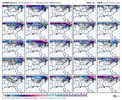
An epic snow pattern was never being shown. A colder pattern was being shown and a colder pattern is still being shownRemember the fantasy epic cold/snow pattern the EPS was predicting....what a shocker to see it evaporate. ?
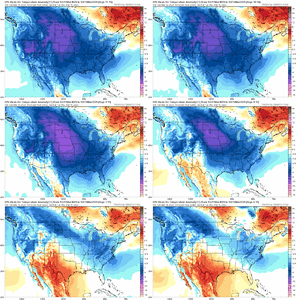
Today's EPS run v/s 3 days ago. Big ole trough in the west now.
View attachment 134041
Pattern that was being modeled that had peoples interest has fallen apart. You can spin it by saying muted BN is still “colder” but that reaching.An epic snow pattern was never being shown. A colder pattern was being shown and a colder pattern is still being shown


I don't know what the big lovefest is with the EPS. I mean, you can roll out global model scores if you want, but in terms of being what I would call a good and reliable model/suite, it's far from it. Anecdotally, it seems to shift around way more than it used to.Remember the fantasy epic cold/snow pattern the EPS was predicting....what a shocker to see it evaporate. ?
Today's EPS run v/s 3 days ago. Big ole trough in the west now.
View attachment 134041
I suppose. Before it was a mainly cold and dry pattern which would’ve been hard to get snow regardless but very below normal.. now it’s just below normal and some periods of precip but we would need either more cold air or weird phasing/ amplifications to be able to get some snow in the upper SE regions which fight now isn’t being modeled. But we are going to say goodbye to the 70-80s and see frost and freeze potentials coming back into the picture for a bit.Pattern that was being modeled that had peoples interest has fallen apart. You can spin it by saying muted BN is still “colder” but that reaching.
Compared to its counterparts? It's the best one we have available.I don't know what the big lovefest is with the EPS. I mean, you can roll out global model scores if you want, but in terms of being what I would call a good and reliable model/suite, it's far from it. Anecdotally, it seems to shift around way more than it used to.
If you're comparing rabbit poop to horse poop, I guess I would go with rabbit poop. But at the end of the day, they're both poop. But calling it a good model is just plain bull poop.Compared to its counterparts? It's the best one we have available.
This pretty bad…they were all bad though, I think.I don't know what the big lovefest is with the EPS. I mean, you can roll out global model scores if you want, but in terms of being what I would call a good and reliable model/suite, it's far from it. Anecdotally, it seems to shift around way more than it used to.
Disagree 100%. Using the mean temps and smoothed anomalies past D5 as the data point of truth is the poop. It's obvious the eps is going to bust to a degree here but when 70% of the members are going to fall within 5 degrees of where we probably verify it looks good to meIf you're comparing rabbit poop to horse poop, I guess I would go with rabbit poop. But at the end of the day, they're both poop. But calling it a good model is just plain bull poop.
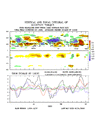
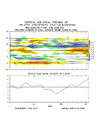
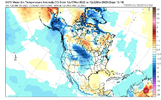
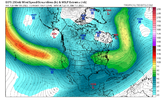
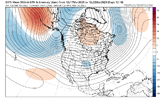
Yep, not that cold pattern I’ve seen posted the past 6 weeks.Nice. Tons of +AAM set to go poleward and too much +EAMT. How to get the pacific jet in California. Not ideal for extended cold at all. Even with shortened wavelengths. Favors a fast and progressive pattern and shuts off any legit cold source. Wouldn’t shock me if we trend warm to end the month with a stronger than modeled extended pacific jet. It being in Cali already by day 8-9, is not ideal for cold. View attachment 134057View attachment 134058View attachment 134056View attachment 134055View attachment 134054
With March snowstorms you’re likely going to sneak a snowstorm into a string of weather like this (most likely at the beginning or end of it). I’ve seen late March light accumulating snowfall a day after temperatures were in the 70s. You’re not going to get extended cold this time of year, it’s not really possible with how strong the sun is in mid-March, but that doesn’t mean we can’t sneak a nighttime snowstorm in, even if it’s in the upper 50s with a river of melting 24 hours later.

Likely upper 40's and low 50's. Typical average January type day so it will still feel like winter going through the extended. Nobody should've ever expected snow in mid March and I don't think anyone was. Delaying heat and humidity through the extended are wins at this point in the year.
OkDisagree 100%. Using the mean temps and smoothed anomalies past D5 as the data point of truth is the poop. It's obvious the eps is going to bust to a degree here but when 70% of the members are going to fall within 5 degrees of where we probably verify it looks good to me
The 90s were the worst decade for snow here. But guess what? This decade is worse so far. By mid March 93 we had 14.9 inches for the decade. This decade 9.2 inches. Could the 20s become the least snowiest decade? Most likely with how it's started out and the fact it seems way harder to get cold and snow anymore.1990-92 did not feature much winter precip outside of the mountains. 1 small snowstorm along I-20 in 1992 and an icestorm in some of the area just after Christmas 1992. 1996-97 and 1997-98 were not too good either for most of us.
62" but we had 3 double digit seasons. That stretch will probably never be duplicated again.
