As of right now you won’t be. It’s been closed because it’s been so dangerous with low snow levels and mud. Sapphire is suppose to reopen this Friday but look at the forecast...multiple inches of rain and hot weather.Taking the kiddos on MLK weekend to the bunny slopes at Sapphire Valley and maybe Cataloochee. Verbatim on the 06z GFS, they may be smiling.
Sent from my iPhone using Tapatalk
-
Hello, please take a minute to check out our awesome content, contributed by the wonderful members of our community. We hope you'll add your own thoughts and opinions by making a free account!
You are using an out of date browser. It may not display this or other websites correctly.
You should upgrade or use an alternative browser.
You should upgrade or use an alternative browser.
Pattern January 2020 - Operation Thaw Alaska
- Thread starter KyloG
- Start date
Well if that isn’t encouragingMJO keeps going!

Jon
Member
MJO keeps going!
People can’t deny this one, it’s definitely an MJO wave. The cool thing is models are predicting a pattern change by this time, and as Webb has said, phase 7 supports snow storms in NC. Not only that, but Baxter et al. says expect cold 10-20 days after Phase 7 during winter months. Since this is high amplitude, I’m not expecting a transient cold shot but a more sustained pattern of cold and stormy.
The euro looks like it wants to get some blocking going as well at the end of the run.
Sent from my iPhone using Tapatalk
I thought winter was over@SD
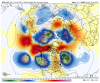
This is exactly what we were talking about happening out west. It is hard to believe that it actually might play out that way. Euro isn't quite there, but it's showing some signs of hopping onboard. If this plays out, there will be more than one really legit opportunity for widespread winter weather.
View attachment 30030
View attachment 30031
View attachment 30032
Sent from my SM-G975U using Tapatalk
ForsythSnow
Moderator
Let's keep accelerating through 4,5, and 6. And let's hope we can throw ourselves deep enough into 8 and loop into 1 instead of crash back into the COD and go back into 4.MJO keeps going!
MJO keeps going!
Before getting to better phases, this is the strongest GEFS phase 5 run yet with ~4 amp on 1/12/20, which would be close to a record strongest phase 4 or 5 for winter going back to 1975! Even if slightly overdone (my guess), it would still be the second strongest by a good margin.
EastAtlwx
Meteorologist
What are the implications of this if we carry the high amp into phase 7? I think things could get interesting if we enter phase 7 at a high amplitude (which eric has shown some sort of correlation with SE winterstorms, is that correct) & kinda dive towards the circle but at an angle towards 8...Before getting to better phases, this is the strongest GEFS phase 5 run yet with ~4 amp on 1/12/20, which would be close to a record strongest phase 4 or 5 for winter going back to 1975! Even if slightly overdone (my guess), it would still be the second strongest by a good margin.
packfan98
Moderator
See Jon's tweet. I've also read from a couple of mets that think we will get to 8.What are the implications of this if we carry the high amp into phase 7? I think things could get interesting if we enter phase 7 at a high amplitude (which eric has shown some sort of correlation with SE winterstorms, is that correct) & kinda dive towards the circle but at an angle towards 8...
I know it favors winter storms in the Carolina's, Larry @GaWx has noted many times that the COD is good for winter weather (focused on Atl). I'm curious if P7 and P8 are as good in the deep south as it is for the Carolina'sWhat are the implications of this if we carry the high amp into phase 7? I think things could get interesting if we enter phase 7 at a high amplitude (which eric has shown some sort of correlation with SE winterstorms, is that correct) & kinda dive towards the circle but at an angle towards 8...
I know that Phase 7 has been money for Central and Eastern NC, especially since 1985, but I’m just curious as to how well we’ve done when it’s that amped up.MJO keeps going!
You need to stay out of the Whamby thread!I thought winter was over
Sent from my SM-G975U using Tapatalk
NoSnowATL
Member
You need to stay out of the Whamby thread!
I’ve canceled and un canceled 2 times I think . I’ll save my last one for February.
Sent from my iPhone using Tapatalk
I know it favors winter storms in the Carolina's, Larry @GaWx has noted many times that the COD is good for winter weather (focused on Atl). I'm curious if P7 and P8 are as good in the deep south as it is for the Carolina's
For ATL, there have been 8 different storms that produced either major ZR or major IP since MJO phase records started in 1975. For 7 of these 8, the MJO was inside the COD and the other one was in the COD one of the 2 days of the storm.
OTOH, major snows were different.
Looks like Texas, Oklahoma and Arkansas are trending a little snowier in the short term on the GFS. Nice to see winter somewhere in the s/e.
Nice to see a little Blocking showing up for the first time in a while

Six Mile Wx
Member

All in. ?. No need to wait till Fab Feb, January looks to be lit for 2 weeks. Lower elevations will be crying for spring by the time February is here.
Shaggy
Member
Looks promising. Let's hope the STJ stays juiced and rolling when these cold shots get in here.
RollTide18
Member
It seems like it took forever to get the 540 line down this way

D
Deleted member 1449
Guest
Maybe we will finally thaw Alaska! 

ForsythSnow
Moderator
But once it's down there, it doesn't want to go very far even with an incoming front. Maybe we can finally get some nice cold and snow out of this.It seems like it took forever to get the 540 line down this way
It's really good to see a few back to back LR progs depict a favorable progression. If this continues, we are going to see some big winter storms show up. The very end of the run is close and shows the potential that I feel the pattern is capable of, if it comes to pass.
Weren’t u saying like 2 hours ago it wasn’t going to happen since we’ve been “hot” and wetAll in. ?. No need to wait till Fab Feb, January looks to be lit for 2 weeks. Lower elevations will be crying for spring by the time February is here.
NWMSGuy
Member
This might be a ridiculous question, but knowing how models can flip from one run to the next, how often do these MJO models flip? I'm hoping like most the MJO continues to move into more favorable phases for the Southeast.
Valid question. The other day we were seeing it dying in ph6. BUT it was still oh so close to ph7 before doing so..So hopefully we are moving in a favorable direction now. I’m with @Rain Cold..I think we’re about to start seeing some big dogs show up inside and around the 240 mark.This might be a ridiculous question, but knowing how models can flip from one run to the next, how often do these MJO models flip? I'm hoping like most the MJO continues to move into more favorable phases for the Southeast.
They're basically on the same latitude as we are further east. They can score and we can't, all thanks to the eastern ridge!Looks like Texas, Oklahoma and Arkansas are trending a little snowier in the short term on the GFS. Nice to see winter somewhere in the s/e.
Sent from my SM-A102U using Tapatalk
This might be a ridiculous question, but knowing how models can flip from one run to the next, how often do these MJO models flip? I'm hoping like most the MJO continues to move into more favorable phases for the Southeast.
Not a ridiculous question at all and true just the other day it was dying in P6 but and I don't know for sure (someone will correct me I'm sure) but it seems to me that usually what happens is what we are seeing. It doesn't necessarily flip but corrects or extends to the next phase, especially when it is amped. I just don't recall a very amped MJO wave just collapsing as quickly as what the GEFS was showing the other day, and if this holds then hopefully it will also traverse into P8. But as you can tell by my verbiage, an MJO expert I ain't.Valid question. The other day we were seeing it dying in ph6. BUT it was still oh so close to ph7 before doing so..So hopefully we are moving in a favorable direction now. I’m with @Rain Cold..I think we’re about to start seeing some big dogs show up inside and around the 240 mark.
Last edited:
Mostly thanks to less maritime influence and no App ridge to block the cold airThey're basically on the same latitude as we are further east. They can score and we can't, all thanks to the eastern ridge!
Sent from my SM-A102U using Tapatalk
Jon
Member
This might be a ridiculous question, but knowing how models can flip from one run to the next, how often do these MJO models flip? I'm hoping like most the MJO continues to move into more favorable phases for the Southeast.
The MJO phase diagram is based on modeling so technically they can flip and change around by going in a different direction, but at high amplitude are more predictable and less likely to flip because the MJO is a measure of tropical rainfall and circulation, and as it moved eastward, enters different “phases”. Because we are confident we have a strong MJO, it’s less likely to all of a sudden turn around and go back to Phase 4 or 5, because since it’s moving East, it has to go counter clockwise on the phase diagram.

By just following precipitation accumulation on this composite, you can see how it moves from left to right (west to east) and the corresponding phases.

There’s other ways to look at the MJO, through 200VP maps and OLR maps, but they’re all measuring the same propagation of the wave...so I find it’s easier for people to look at precipitation diagrams or OLR (outgoing long wave radiation) which measures thunderstorm activity as a way of “tracking” the MJO. The blue colors in the following diagrams is lower OLR (strong thunderstorms have high cooler/cold cloud tops, which registers as low on this chart) as you can see the blue lines up with the precip maps above.

It’s much easier for the MJO diagram to loop around and change direction when there’s not a prominent wave and some other waves are impacting the phase diagrams, such as the tropical storms north of Australia we saw, spiking us into Phase 4.
I know very little about the MJO and still trying to learn but I hope this helps.
Sent from my iPhone using Tapatalk
NWMSGuy
Member
Thanks for the explanation!Not a ridiculous question at all and true just the other day it was dying in P6 but and I don't know for sure (someone will correct me I'm sure) but it seems to me that usually what happens is what we are seeing. It doesn't necessarily flip but corrects or extends to the next phase, especially when it is amped. I just don't recall an very amped MJO wave just collapsing as quickly as what the GEFS was showing the other day, and if this holds then hopefully it will also traverse into P8. But as you can tell by my verbiage, an MJO expert I ain't.
@Jon explanation is 10x better however... LolThanks for the explanation!
packfan98
Moderator
Downeastnc
Member
@Jon explanation is 10x better however... Lol
LOL yeah I was like this is why I visit these boards.....
NWMSGuy
Member
I'm learning just as much as the next person so this certainly helps! Thanks for the detailed info!The MJO phase diagram is based on modeling so technically they can flip and change around by going in a different direction, but at high amplitude are more predictable and less likely to flip because the MJO is a measure of tropical rainfall and circulation, and as it moved eastward, enters different “phases”. Because we are confident we have a strong MJO, it’s less likely to all of a sudden turn around and go back to Phase 4 or 5, because since it’s moving East, it has to go counter clockwise on the phase diagram.

By just following precipitation accumulation on this composite, you can see how it moves from left to right (west to east) and the corresponding phases.

There’s other ways to look at the MJO, through 200VP maps and OLR maps, but they’re all measuring the same propagation of the wave...so I find it’s easier for people to look at precipitation diagrams or OLR (outgoing long wave radiation) which measures thunderstorm activity as a way of “tracking” the MJO. The blue colors in the following diagrams is lower OLR (strong thunderstorms have high cooler/cold cloud tops, which registers as low on this chart) as you can see the blue lines up with the precip maps above.

It’s much easier for the MJO diagram to loop around and change direction when there’s not a prominent wave and some other waves are impacting the phase diagrams, such as the tropical storms north of Australia we saw, spiking us into Phase 4.
I know very little about the MJO and still trying to learn but I hope this helps.
Sent from my iPhone using Tapatalk
Not a ridiculous question at all and true just the other day it was dying in P6 but and I don't know for sure (someone will correct me I'm sure) but it seems to me that usually what happens is what we are seeing. It doesn't necessarily flip but corrects or extends to the next phase, especially when it is amped. I just don't recall an very amped MJO wave just collapsing as quickly as what the GEFS was showing the other day, and if this holds then hopefully it will also traverse into P8. But as you can tell by my verbiage, an MJO expert I ain't.
There's this to consider: there have been 15 very high amp phases 4/5 and all 15 went on to reach phase 7 though two of those got to phase 7 only within the COD and another case was barely outside the COD when in 7.
So maybe high amp 5-6 is a necessary evil if we want to see 7-8-1-2..just got to make sure we aren’t entering high amp 4-5-6 during peak winter climo..maybe it’s not too late..maybe this could all work out ??
Makes you wonder...last 2 years we went though low amp 7-8-1-2 and high 7-8-1-2 for Jan into Feb which resulted in the same pattern GEFS keeps spitting out. Things that make you go hmmm...


Last edited:
SnowNiner
Member
Makes you wonder...last 2 years we went though low amp 7-8-1-2 and high 7-8-1-2 for Jan into Feb which resulted in the same pattern GEFS keeps spitting out. Things that make you go hmmm...
View attachment 30059View attachment 30060View attachment 30058View attachment 30057
Wow, that's a good point. All this mjo discussion could be hogwash. Didn't help us the last 2 years.