Webberweather53
Meteorologist
Speaking of the CFS...
Here comes a big MJO wave into the Indian Ocean in late Dec... or not.

Here comes a big MJO wave into the Indian Ocean in late Dec... or not.
What will the implications be for the SE with that Mjo wave?Speaking of the CFS...
Here comes a big MJO wave into the Indian Ocean in late Dec... or not.
View attachment 26949
Speaking of the CFS...
Here comes a big MJO wave into the Indian Ocean in late Dec... or not.
View attachment 26949

AleeeeeeeeeeeeeetView attachment 27277
I think it means autumn 2018 flipped at the last minute and I do remember that happening. The were consistently showing a cold winter ‘18-‘19 and then did a complete flip at the same time this opposite flip is occurring this yearI'm confused, does he mean Autumn of 2018? Is he comparing last year to this year's seasonal? IIRC, ALL the seasonals showed a cold winter and all busted last year. I don't recall them flipping but I could be wrong. Not sure how them flipping this year means anything.
I think the only thing that's had any bit of long term accuracy is the end of the month CFSv2. It showed torch for December and it looks like it may bust too warm (we'll see). So I'm taking any seasonal long range guidance with a mountain of salt. I'm latching on to HM's IOD convection death, western hemisphere, phase 8-2 MJO mountain torque, TMNT, Scandinavian Ridge = -NAO blocking as our hope for this year. Yeah I don't understand it, but that's all I got.


Do we want + or - IOD lol i can't keep trackIOD is tanking quickly, right on time View attachment 27701
Do we want + or - IOD lol i can't keep track
Do we want + or - IOD lol i can't keep track
In January, the +IOD is a cold signal in the Rockies/Plains, where it indeed has been cold especially north, but the correlation in the E and SE US is very small/neutral.
I'm sure this is just meant for the NE:
Why are you posting this in the Whamby thread? This looks really good. I'm going to move it. 2m temps and 850s are cold at D10 too!


What's up Big Frosty! Would that, by any chance, be the Pioneer model?Joe D'Aleo on Southeast update yesterday! Hang on grasshopper..............................
When the stratosphere has its warming, the trough should anchor to the east and cold should develop.
View attachment 27944
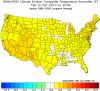
January to March Anomalies
What's up Big Frosty! Would that, by any chance, be the Pioneer model?
Haha, you know it's rough when they're rolling out the Pioneer and the Deep Thunder and the Brazilian (which, I don't think we've seen that one pulled so far this year?).It may be he didn't say! But the last time I seen him post the Pioneer model (which it's been a while) it DID look a lot like this for same time period! lol

It’s starting way higher than last year though before dropping.IOD is tanking quickly, right on time View attachment 27701


In this age of GW, here's something encouraging for the upcoming January: since 2000 and even just since 2010 Jan in the SE US has somehow averaged about the same as Jans 1895-1999! It is like January is on a climo island because no other month since 2000/2010 has been about the same vs pre 2000 even though November is not too far off:
View attachment 28520
View attachment 28524
View attachment 28525
View attachment 28526
Looking at KATL, specifically, check these stats out for each month when comparing the 2010s, alone, vs 1895-2010s:
JAN: +0.6 (best and keep in mind that this 0.6 could easily be due to airport related warming)
FEB: +2.9 (3rd worst)
MAR: +2.4
APR: +2.7
MAY: +2.5
JUN: +2.4
JUL: +2.1
AUG: +2.2
SEP: +3.1 (2nd worst)
OCT: +2.7
NOV: +1.2 (2nd best)
DEC: +3.8 (worst)
So, JAN and, to a lesser extent, NOV stand out as having had the least warming. What's even more interesting is that those 2 months surround the worst month, Dec!


That progression is fantastic. Hope it continues.Obvious shift with the GEFS with a better pac ridge and in response the TPV has been headed south


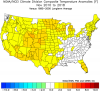
CFS with a decent example of the North American Winter Temperature Dipole for January 2020. Would result in a cold East coast and possibly stormy.

This is a composite from NAWTD events 1980-2015

We saw something similar in 2017, of course this had strong blocking but I’d assume some would materialize with this pattern.

And yes it means cold AND stormy. We had a storm that year on Dec 9, impacting the mountains the most, and foothills/piedmont.
Sent from my iPhone using Tapatalk

then don't look ...
I don’t like seeing this!
Sent from my iPhone using Tapatalk