I don't think it has been posted or that it matters, but TWC is going with a cold east for their winter forecast.
-
Hello, please take a minute to check out our awesome content, contributed by the wonderful members of our community. We hope you'll add your own thoughts and opinions by making a free account!
You are using an out of date browser. It may not display this or other websites correctly.
You should upgrade or use an alternative browser.
You should upgrade or use an alternative browser.
Wintry Winter 2019-20 Discussion
- Thread starter Snowfan
- Start date
NoSnowATL
Member
I don't think it has been posted or that it matters, but TWC is going with a cold east for their winter forecast.
It did work well for them last year.
Sent from my iPhone using Tapatalk
Cadi40
Member
I really have a good feeling about this winter. In the summer of 2013 I moved from South Florida to Charlotte. It was our first winter here, 2013-2014, that we had an above average season. We were worried if it was going to be like that every year. We haven’t had another winter like that in quite a while, and I feel like this year will be comparable.
Webberweather53
Meteorologist
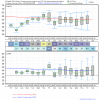
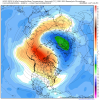
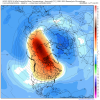
Didn't just yesterday it show a big -NAO?Who you got. The EPS modeled pacific pattern gives me nightmares.
View attachment 26043View attachment 26044View attachment 26045
Today’s runs look cooler for us, will worry about the pacific later! Getting by on not perfect looks, is what we do!
Jon
Member
The December torch could be in jeopardy if it starts off like that. I’ll take a near normal December any year.
Sent from my iPhone using Tapatalk
tennessee storm
Member
Yea. Way to much zonal flow for us. If that verifies....Didn't just yesterday it show a big -NAO?
tennessee storm
Member
Yea me too... along as January will turn out below normal temps ... i take my chancesThe December torch could be in jeopardy if it starts off like that. I’ll take a near normal December any year.
Sent from my iPhone using Tapatalk
Today with this tight gradient around the Carolinas, a lot of leaves will be falling and I’m worried about field goals today to lol.
Sent from my iPhone using Tapatalk
Sent from my iPhone using Tapatalk
Golf7575
Member
When i go to the daculaweather.com website, there are many models that show the mjo forecast. Does anyone know which model would possibly be correct with the mjo progression currently? Just curious.
Yea. Way to much zonal flow for us. If that verifies....
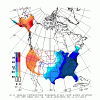
Regarding your reference to 0Z EPS 11-15: Please explain when you say "way too much zonal flow for us". It is the coldest run yet despite less -NAO and even has your area 4 F colder than normal as Webb's map has. The entire SE is in solid cold with RDU to @pcbjr a whopping -5 anom! Granted, the next run could easily back off of this some but -4 to -5 over nearly the entire SE way out at 11-15 on a warm biased EPS (51 members) is just about as cold an outlook as you're going to see these days outside of some rarities.
pcbjr
Member
Hey, Larry ...Regarding your reference to 0Z EPS 11-15: Please explain when you say "way too much zonal flow for us". It is the coldest run yet despite less -NAO and even has your area 4 F colder than normal as Webb's map has. The entire SE is in solid cold with RDU to @pcbjr a whopping -5 anom! Granted, the next run could easily back off of this some but -4 to -5 over nearly the entire SE way out at 11-15 on a warm biased EPS (51 members) is just about as cold an outlook as you're going to see these days outside of some rarities.

Last edited:
tennessee storm
Member
100 percent agreeProbably should have clarified my post above...yes the EPS is cold through Nov but was more about where it’s going into Dec. I don’t like the ridge building off the Aleutians, but that could be gone in the next few days.
View attachment 26055
pcbjr
Member
Pattern right now is great. December has concerned me (not worried me, but concerned me) for a couple weeks, based on numerous factors (most of which others have raised, so no point in reiteration). It's almost like going to the fair and possibly spending all the money in your pocket on small booths before getting to the ticket counter for the big roller coaster ride ...Probably should have clarified my post above...yes the EPS is cold through Nov but was more about where it’s going into Dec. I don’t like the ridge building off the Aleutians, but that could be gone in the next few days.
View attachment 26055
NBAcentel
Member
What is going on with the PDO right now, almost like a modoki +PDO lol or just a +PDO shifted west
Webberweather53
Meteorologist
The December torch could be in jeopardy if it starts off like that. I’ll take a near normal December any year.
Sent from my iPhone using Tapatalk
Below normal Decembers are generally less frequent than below normal Februarys (obviously) in NINO winters, the ones that are BN in December often (but not always) produce a big dog east of the mtns in NC in Dec.
1896-97, 1904-05, 1905-06, 1930-31, 1958-59, 1963-64, 1969-70, 1997-98, 2002-03, 2004-05, & 2009-10 come to mind as good examples.
Last edited:
ForsythSnow
Moderator
Nov weak ninos with npac lows tend to precede BN winters.
Just to check, do you or anyone else know of any winters with this setup that had the winter turn up AN? I also wonder how much "most" means.
Just to check, do you or anyone else know of any winters with this setup that had the winter turn up AN? I also wonder how much "most" means.
I posted on this a while back, not a big sample size. But these are the BN weak ninos over past 40 years. Nov patterns compared to this Nov.
Still expecting AN winter though


I would much rather have this setup going into the winter season. Having the hi5 maps looking like this and working for a active storm track later. The ULL in the SW is having an impact on our STJ stream. With out this we should become more stormy.
Sent from my iPhone using Tapatalk
Sent from my iPhone using Tapatalk
Eric
Member
The December 2, 1896 snowstorm came oh so close to occurring in November.Below normal Decembers are generally less frequent than below normal Februarys (obviously) in NINO winters, the ones that are BN in December often (but not always) produce a big dog east of the mtns in NC in Dec.
1896-97, 1904-05, 1905-06, 1930-31, 1958-59, 1963-64, 1969-70, 1997-98, 2002-03, 2004-05, & 2009-10 come to mind as good examples.

What a time to be aliveThe December 2, 1896 snowstorm came oh so close to occurring in November.View attachment 26087
Should be a banner winter for the Himalayas too...
Know nothing about the jamstec, but our Japanese friends are predicting a sweet winter for the Eastern US: View attachment 26099
That would be incredible. But unfortunately, it looks just like the JAMSTEC maps for last winter such as this one that actually had much of the SE even colder (3-4 F colder than normal):

Last edited:
Webberweather53
Meteorologist
Slowly but surely, as tropical forcing returns to the Indian Ocean & Eastern Hemisphere in general, the SE US ridge will attempt to make a return to the larger-scale pattern.
The long range EPS is trending in that direction. The only thing that's saving us from disaster is the blocking high over the Baffin Bay, eventually due to diffusive, radiative, & dissipative processes, it will run its course.

The long range EPS is trending in that direction. The only thing that's saving us from disaster is the blocking high over the Baffin Bay, eventually due to diffusive, radiative, & dissipative processes, it will run its course.

Yeah, I would definitely expect to warm up at some point. At least we are seeing the propensity for blocking. Looking out 10 days, you can still see that signal, which is encouraging. Hopefully, the Pacific will not turn hostile and remain that way this year.Slowly but surely, as tropical forcing returns to the Indian Ocean & Eastern Hemisphere in general, the SE US ridge will attempt to make a return to the larger-scale pattern.
The long range EPS is trending in that direction. The only thing that's saving us from disaster is the blocking high over the Baffin Bay, eventually due to diffusive, radiative, & dissipative processes, it will run its course.
View attachment 26102
Golf7575
Member
Rain, i agree. That is why i asked what model is handling the mjo correctly moving forward. Especially the site i previously mentioned that dacula has. Ultimately December will be warm regardless of what we want lol, but i just want one decent pattern for cold and winter weather.Yeah, I would definitely expect to warm up at some point. At least we are seeing the propensity for blocking. Looking out 10 days, you can still see that signal, which is encouraging. Hopefully, the Pacific will not turn hostile and remain that way this year.
LovingGulfLows
Member
- Joined
- Jan 5, 2017
- Messages
- 1,496
- Reaction score
- 4,086
Looks like the EPS wants to put us at the baroclinic zone which potentially means severe weather.
Looks like the EPS wants to put us at the baroclinic zone which potentially means severe weather.
Hopes it’s during the time of cold air in place.
Sent from my iPhone using Tapatalk
Webberweather53
Meteorologist
"Larry Cosgrove: Indian summer is no longer going to happen this month in east. Be very wary of accepting any extensive warming trends across the lower 48 states in December. "
Lol, this is the kiss of death! Torch inbound!
Lol, this is the kiss of death! Torch inbound!
NWMSGuy
Member
Wonder what his thinking is behind that statement."Larry Cosgrove: Indian summer is no longer going to happen this month in east. Be very wary of accepting any extensive warming trends across the lower 48 states in December. "
Lol, this is the kiss of death! Torch inbound!
NoSnowATL
Member
Wonder what his thinking is behind that statement.
The JB Effect
Sent from my iPhone using Tapatalk


