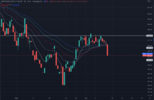
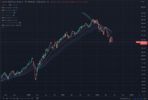
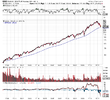
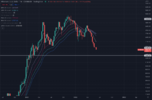
Well let’s see…gas has gone up, food prices are up. I can’t imagine it’s pretty.CPI leak?
-
Hello, please take a minute to check out our awesome content, contributed by the wonderful members of our community. We hope you'll add your own thoughts and opinions by making a free account!
You are using an out of date browser. It may not display this or other websites correctly.
You should upgrade or use an alternative browser.
You should upgrade or use an alternative browser.
Misc Stock Market
- Thread starter ForsythSnow
- Start date
buckinbronco
Member
Agreed, unless they are cooking the booksWell let’s see…gas has gone up, food prices are up. I can’t imagine it’s pretty.
Nice win! Fugly dayWelp
No snow for you
Member
- Joined
- Dec 28, 2016
- Messages
- 582
- Reaction score
- 888
Thank God we ditched the 300 point rule. I hated that thingNice win! Fugly day
D
Deleted member 609
Guest
D
Deleted member 609
Guest
Eh this not good. If this ----- says inflation is going down we are likely going to be Zimbabwe by next Tuesday.

 markettimes.co.uk

Why is Cathie Wood convinced that inflation will go down? | Market Times
Cathie Wood is convinced that inflation reached its highest point in March and that it will begin to fall more and more strongly. His argument for her? She claims that US companies saw a big increase in their inventories.
 markettimes.co.uk
No snow for you
Member
- Joined
- Dec 28, 2016
- Messages
- 582
- Reaction score
- 888
Inflation is hot hot hot. Let's go Dow O/U -842
Over!!!Inflation is hot hot hot. Let's go Dow O/U -842
So by over you mean more than -842 (as in -900 would be over), not sure how these O/U work on negative numbers lolOver!!!
Welp
Higher, Bob! -841 would be over. NSFW is giving us a free win today!So by over you mean more than -842 (as in -900 would be over), not sure how these O/U work on negative numbers lol
At what point do the whales get tired of this seesaw Mickey Mouse market where we churn and burn between CPI reports every month? When do they really rip the bandaid off this thing and let it fall hard?
Storm5
Member
At what point do the whales get tired of this seesaw Mickey Mouse market where we churn and burn between CPI reports every month? When do they really rip the bandaid off this thing and let it fall hard?
Hopefully today lol
Sent from my iPhone using Tapatalk
Getting destroyed on my dip buy this morning ?
VegasEagle
Member
Down 736 Will it hit 800?
D
Deleted member 609
Guest
Getting ------ in my ass today. Hope all is well with you all.
VegasEagle
Member
775 hittingDown 736
Storm5
Member
Amazon puts up 389 percent lol . Only have 3
Sent from my iPhone using Tapatalk
Sent from my iPhone using Tapatalk
D
Deleted member 609
Guest
Might be worth taking a few lotto calls. Doubt its green by eod, but might jump up some.
No snow for you
Member
- Joined
- Dec 28, 2016
- Messages
- 582
- Reaction score
- 888
welp
VegasEagle
Member
Down 809, anyone thinks 900 will print?
I can't believe the Fed was calling this transitory for so long....how in the world did they get in those jobs. Anyone else would have been fired for being inept.
lexxnchloe
Member
Something not getting as much attention. Consumer sentiment plunged to an alltime low of 50.2I can't believe the Fed was calling this transitory for so long....how in the world did they get in those jobs. Anyone else would have been fired for being inept.
Something not getting as much attention. Consumer sentiment plunged to an alltime low of 50.2
Our economy is going to be wrecked for years....we are so screwed.
Storm5
Member
VIX melting faces
Sent from my iPhone using Tapatalk
Sent from my iPhone using Tapatalk
No snow for you
Member
- Joined
- Dec 28, 2016
- Messages
- 582
- Reaction score
- 888
I don't think Years. At least not in the US. Rest of the world is screwed for years but the US should Boom maybe next year.Our economy is going to be wrecked for years....we are so screwed.
Down $500 on dip buys this morning after the dump. Cant imagine how it feels to hold overnight through a move like this…
I hope. Send helpMight be worth taking a few lotto calls. Doubt its green by eod, but might jump up some.
Probably get close
Right now it's a suckers market...algos are toying with everyone. $290.8 was a pivot this morning, they took it above, stopped out shorts and are now bleeding it back down. Just an awful market, been awful all week. I haven't done anything today and much of anything this week. I said last week I was going to take 2 weeks off and really should have done that.
Next week is FOMC and quad witching.
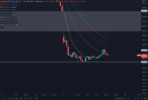
Next week is FOMC and quad witching.

Here we go
Storm5
Member
No snow for you
Member
- Joined
- Dec 28, 2016
- Messages
- 582
- Reaction score
- 888
Where are going?Here we go

