All eight phases mean no snow for us, so I don’t pay much attention to it, anyways.I always have understood that the deeper we go into March, the less impact MJO has
-
Hello, please take a minute to check out our awesome content, contributed by the wonderful members of our community. We hope you'll add your own thoughts and opinions by making a free account!
You are using an out of date browser. It may not display this or other websites correctly.
You should upgrade or use an alternative browser.
You should upgrade or use an alternative browser.
Pattern Muddy March 2021
- Thread starter SD
- Start date
NBAcentel
Member
Backed off on the GFS/GEFS, but v16 was a bit colder, hopefully models trend warmer in time !I guess next weekend’s cold snap disappeared
Backed off on the GFS/GEFS, but v16 was a bit colder, hopefully models trend warmer in time !
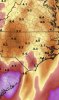
Before then, remember for March 2nd when the GFS was way colder than the Euro and the GFS had very close calls to ZR whereas the Euro hardly even had any CAD or rain? Well, since then the GFS has warmed some, but the EPS has trended significantly colder, especially with today's Happy Hour run, and now has a full blown CAD with generous QPF (see top map). The 2nd map shows 850s, which are largely in the +3 to +6 C range for the major CAD areas of NC/SC/GA.
Note that with a solid wedge from an Arctic high, 850s of +3 to +6 C are right in the wheelhouse for major SE CAD region ZR events per history. This Arctic high has a cross polar connection and it comes down courtesy of the TPV. Just 3 days earlier (Feb 27) in NW Canada, it has lows in the -40s F, highs in the -30s F, and 850s as cold as -40 C! So this is absolutely frigid air! Also note that there have been a good number of major ZR/IP events ~March 2nd in the SE in history such as 1948, 1960, 1962, and 1980.
So, this is back to a "need to be watched" imo, especially for the major CAD areas, even if it doesn't trend colder than this run. Note that this is now only 5 days out. not in fantasy land. If it were to trend even colder and/or the high trend stronger to, say, 1035 mb or stronger, there could potentially be a more widespread wintry mess on March 2-3, including more IP and maybe even snow in some areas. So, keep your eyes on this for the time being.


****Edited for typo as 850s are +3 to +6 C, not -3 to -6 lol.
Last edited:
NBAcentel
Member
I literally can’t stand this season it’s terrible, I hate it 

NBAcentel
Member
There’s the look y’all weenies wanted 

The result is 33 and rain
The result is 33 and rain
This is why we need composite maps haha
This might have been discussed before and if so, I apologize for the repeat question, but what do you mean by composite maps? What do they help with?
Last edited:
There’s the look y’all weenies wanted View attachment 76995View attachment 76996
The result is 33 and rain
Yep, a day late and a dollar short, as always, here in the SE. We always get a good look like this when it's either too early in the winter or too late.
Last edited:
NBAcentel
Member
So depressing 
As shown, 0Z Icon (and 18Z and I think 12Z Icon) and 18Z Euro have a ZR threat now for 3/2-3. Although cold biases always need to be kept in mind, this potentially may be a real deal considering how cold the origins of this Arctic high are.
NBAcentel
Member
Icon has been way to aggressive with LLVL cold in wedges lately, that’s probably more like 33-36 and rainAs shown, 0Z Icon (and 18Z and I think 12Z Icon) and 18Z Euro have a ZR threat now for 3/2-3. Although cold biased always need to be kept in mind, this potentially may be a real deal considering how cold the origins of this Arctic high are.
NBAcentel
Member
I wonder what 850s/925s were on the icon, honestly not far from a snow look per H5
It's probably close but the timing is likely too late and the deamplifying wave doesn't help eitherI wonder what 850s/925s were on the icon, honestly not far from a snow look
Just 500mb and surface temps maps that show what the US would look like in each mjo phase by month, then in biweekly segments, then by enso phase during those time periods. then add in a few other variables. It would certainly be interesting to see where those have us going if we do get an mjo progression from P7-1This might have been discussed before and if so, I apologize for the repeat question, but what do you mean by composite maps? What do they help with?
Probably fairly close to average unless you drop rain or clouds in. That big gyre though could be problematic for any warm-up if it stayed around. On the bright side the op Euro was in the bottom 10% of the suite with the cold shot at days 9-10So depressing View attachment 76997
NBAcentel
Member


NBAcentel
Member


Iceagewhereartthou
Member
When it comes to temps, if you're sad then I'm happy. Bring it!What a disaster View attachment 76959
NBAcentel
Member

NBAcentel
Member
Not even close, wow I expected betterIt's probably close but the timing is likely too late and the deamplifying wave doesn't help either

NBAcentel
Member
?

NBAcentel
Member
Yeah the v16 shows that then torches us/AN temps , I’d imagine once the wannabe rex Block in the pacific falls apart as the trough wants to move East, that brings back SW flow and westernly momentum to kick the EC trough out, but that’s just speculationThe AO, NAO, and PNA combo couldn’t be much worse than it is for overall cold pattern prospects. So, any cold would likely be short lived.
NBAcentel
Member
This isn’t even a SE us ridge but just a EC torch lol , strange looking pattern 

NBAcentel
Member
Eh this looks like a in-situ CAD setup at best, N/S energy in Canada ruins any forcing for descent 

NBAcentel
Member
Much closer to a severe wx event with that sort of look, esp with a wedge boundary 


NBAcentel
Member
EC trough incoming ? 
NBAcentel
Member
There’s not much cold with this trough lol 

NBAcentel
Member
There it is, took a while 
Lol the negative NAO trend .... laughable

Shaggy
Member
smast16
Member
6z gfs would make the "muddy" part of the thread name quite accurate for the Carolinas
I've scheduled the 2nd week of March off of work to put in a French Drain...

NBAcentel
Member
Cmon GEFS be right 
MichaelJ
Member
I personally struggle with the idea we want to get warm too quickly. You who love warm/hot weather get 7-8 months of it with very few, if any breaks in it. Cloudy days are the norm this winter but once we get to April, it is pretty much never ending sunny and hot days until late October (barring hurricanes). With the models continuing with their samba runs, it becomes tideous to try and figure out which point on their dart board is correct. As for severe, NO thanks, people die and property gets destroyed when it happens.
NBAcentel
Member
Went from this  to this lol
to this lol LickWx
Member
No one is advocating for heat, just mild seasonable weather which this time of year is 60s! You want it to stay below average and cool? That just means 50s then we will jump straight to summer with no in between. That’s exactly what happens every year that we have a cool spring .I personally struggle with the idea we want to get warm too quickly. You who love warm/hot weather get 7-8 months of it with very few, if any breaks in it. Cloudy days are the norm this winter but once we get to April, it is pretty much never ending sunny and hot days until late October (barring hurricanes). With the models continuing with their samba runs, it becomes tideous to try and figure out which point on their dart board is correct. As for severe, NO thanks, people die and property gets destroyed when it happens.
NBAcentel
Member
Delayed but not denied, I’ve seen this story before 
NBAcentel
Member
Temps under that trough is pretty much average 