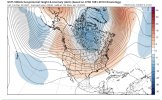
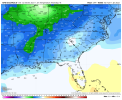
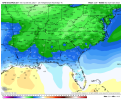
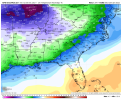
Almost zeroWhat is upstate Sc’s chances with this system. None?
-
Hello, please take a minute to check out our awesome content, contributed by the wonderful members of our community. We hope you'll add your own thoughts and opinions by making a free account!
You are using an out of date browser. It may not display this or other websites correctly.
You should upgrade or use an alternative browser.
You should upgrade or use an alternative browser.
Pattern Januworry
- Thread starter SD
- Start date
Oconeexman
Member
- Joined
- Jan 2, 2017
- Messages
- 1,556
- Reaction score
- 4,250
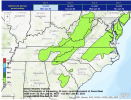
Zero..not one single model or model run has had flake here. Cold air struggles to get over the mountains before the moisture and typically never does. That's why you here us harp on Cad so much. When the cold air gets locked in place which lately doesn't happen much either.What is upstate Sc’s chances with this system. None?
Big step in the gefs toward the eps.
Webberweather53
Meteorologist
Unlike the Dec 8 storm that missed wide right and ended up being too warm, the cold air is in the vicinity and the subtropical branch of the jet is strong/dominant/very El Nino-like. We got some of the right basic ingredients in place to squeeze out an event for a small subset of the board & also get a last second NW/amping trend, which is arguably more critical for folks in the mid-Atlantic, but could be to the benefit for the coastal plain of NC.
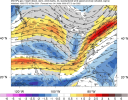

tennessee storm
Member
Be lucky if most see much anything. Cold chasing moisture never works lolAlmost zero
NCHighCountryWX
Member
- Joined
- Dec 28, 2016
- Messages
- 651
- Reaction score
- 1,821
Not a good update.
Chasing something that is just not going to happen this winter
Chasing something that is just not going to happen this winter
I dont know this Looks good to me View attachment 99973
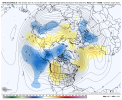
I didn't say it was bad lol just that it went toward the eps. The 0z eps wasn't that bad either contrary to popular belief
Webberweather53
Meteorologist
That’s a good trendView attachment 99976
I didn't say it was bad lol just that it went toward the eps. The 0z eps wasn't that bad either contrary to popular belief
Webberweather53
Meteorologist
I dont know this Looks good to me View attachment 99973
Looking a little more 2013-14/2014-15 like.
Where we signing upLooking a little more 2013-14/2014-15 like.
D
Deleted member 609
Guest
Not a good update.
Chasing something that is just not going to happen this winter
He tryna reverse uno the universe into better trends lol
Okay facts I got confused cause people say the EPS hasn’t been the greatestView attachment 99976
I didn't say it was bad lol just that it went toward the eps. The 0z eps wasn't that bad either contrary to popular belief
I’m guessing the latest GEFS MJO forecast probably gets us into 8 with this lookOh...gefs going for some material you have to buy from behind the counterView attachment 99981
View attachment 99982
Heys stop worrying I still have a couple days of February and March that I’m gonna still watch for winter weather in my outlooks!
Avalanche
Member
Didnt know you lived in Maine.Heys stop worrying I still have a couple days of February and March that I’m gonna still watch for winter weather in my outlooks!
Everybody loses on the 12z GFS.
Too cold to do anything worthwhile, yet not even cold enough for snow.
But that's the pattern change everyone's been cheering on...
Too cold to do anything worthwhile, yet not even cold enough for snow.
But that's the pattern change everyone's been cheering on...
Stephenb888
Member
Man some of you guys were no where to be found when the models were looking great. Misery loves company lol
Avalanche
Member
Many of those didnt believe in the first place.Man some of you guys were no where to be found when the models were looking great. Misery loves company lol
Psalm 148:8
Member
- Joined
- Dec 25, 2016
- Messages
- 341
- Reaction score
- 784
That is usually true… however it better all melt by Saturday the 15 th at 9am!!! I got a massage and weekend at Brasstown Valley lodge and spa!!!I’ll take “wedge holding on longer than modeled” for 1,000
SnowNiner
Member
Wow, that looks pretty great right there. I like the split flow look in the STJ to boot. Watch it be gone to poo next run but I like it! My guess is like has been mentioned GEFS sees phase 8. Bet EPS won't show anything like this because it hates us and loves 7.
It wasn't that far away at 0z. Interestingly the 12z Canadian mean which had been more similar to the eps went toward this look late as well and is a fairly cold run overallWow, that looks pretty great right there. I like the split flow look in the STJ to boot. Watch it be gone to poo next run but I like it! My guess is like has been mentioned GEFS sees phase 8. Bet EPS won't show anything like this because it hates us and loves 7.
This looks really good. Almost like Jan/Feb 2014 pattern all over again. This might be enough to increase Winter storm chances even down to the I-20 areas. The question however, is the GEFS correct on showing this pattern change? The Euro and the EPS have quite cocncerning to say the least and shows much more of a Zonal flow?
I didn't think the 0z eps was that bad, it wasn't something that jumped off the page but it had good pieces in the right places. Certainly want to see if the 12z eps supports the changes in the gefs/geps todayThis looks really good. Almost like Jan/Feb 2014 pattern all over again. This might be enough to increase Winter storm chances even down to the I-20 areas. The question however, is the GEFS correct on showing this pattern change? The Euro and the EPS have quite cocncerning to say the least and shows much more of a Zonal flow?
Stephenb888
Member
I20 areas won’t be getting any winter weather this year. Just my opinion though.This looks really good. Almost like Jan/Feb 2014 pattern all over again. This might be enough to increase Winter storm chances even down to the I-20 areas. The question however, is the GEFS correct on showing this pattern change? The Euro and the EPS have quite cocncerning to say the least and shows much more of a Zonal flow?
Now we're getting somewhere.
cd2play
Member
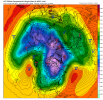
Probably end up being a clipperPattern shown will probably want to send storms up the Apps with a reform off the coast verbatim. But we can definitely work with this.
View attachment 99995
16 days out so who knows. Fingers crossed!
Yeah we would be fighting the good fight with no help in the Natl.Pattern shown will probably want to send storms up the Apps with a reform off the coast verbatim. But we can definitely work with this.
View attachment 99995
16 days out so who knows. Fingers crossed!
NBAcentel
Member
Ron Burgundy
Member
There’s a thread for this fyi.I20 areas won’t be getting any winter weather this year. Just my opinion though.
Misc - 2021-22 Fall/Winter Whamby Thread
Here, snow in Florida. Union county nc will never see snow again because it sold out to freeways and chic filas and soccer fields .
southernwx.com
NBAcentel
Member
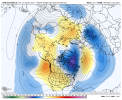
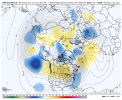
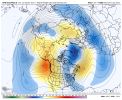
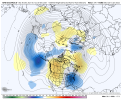
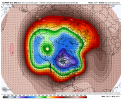
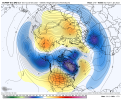
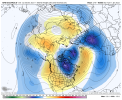
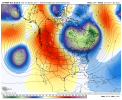
Peep the controlEPS brings back a AK vortex/+EPO and struggles to get any ridging going into AK/NW territories with a shallow western ridge while the GEFS has a -EPO/+PNA View attachment 99998View attachment 99999
NBAcentel
Member

