-
Hello, please take a minute to check out our awesome content, contributed by the wonderful members of our community. We hope you'll add your own thoughts and opinions by making a free account!
You are using an out of date browser. It may not display this or other websites correctly.
You should upgrade or use an alternative browser.
You should upgrade or use an alternative browser.
Pattern December to Remember
- Thread starter SD
- Start date
NBAcentel
Member
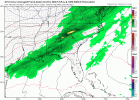
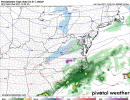
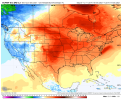
We truly do suck, we trend to this at a range where it’s to late for us but not for VA, wintertime is just a season of tortureLol SE trend continuesView attachment 96916
All three of those years got fairly chilly in JanuaryWhat a trio!!!

Hmmm, temps recover here a lot faster than I expected. Already pushing 70*F again by Wednesday.
LukeBarrette
im north of 90% of people on here so yeah
Meteorology Student
Member
2024 Supporter
2017-2023 Supporter
Y’all will get it at some point, just pray that some people on this board can get a win before the torch ?We truly do suck, we trend to this at a range where it’s to late for us but not for VA, wintertime is just a season of torture
At least November was nice and seasonal. December will not be. That I can guarantee.
Yeah it's disappointing I wouldn't be totally surprised to see this bounce back a little north as we get closer to hour 0 which will be better for rainWe truly do suck, we trend to this at a range where it’s to late for us but not for VA, wintertime is just a season of torture
It’s just a barrage of low pressure systems diving into Alaska and the coastal mountains of western Canada churning that cold in all the wrong places. Those areas are modeled in record cold territory while we experience the opposite.
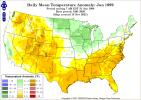
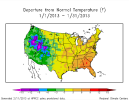
Do you mean Jan '96, '99 and '13?
If so, what you say isn't exactly true for '99 and '13. They were cooler than the prior month, but still above average and certainly no extreme cold.
View attachment 96922
View attachment 96923
Jan '96 was indeed chilly across the NE 2/3rd of the country, but the extreme negative anomalies were over the Northern Plains.
NBAcentel
Member
NBAcentel
Member
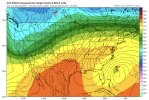
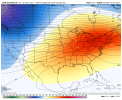
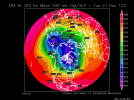
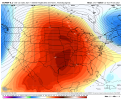
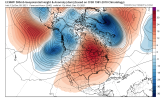
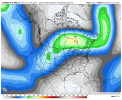
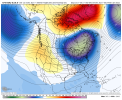
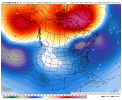
We interrupt this Negative Nelly fest with the following map from the 12Z GEFS showing H5 that is quite a bit different vs earlier runs. The change starts late next week and shows the typical uncertainty out just past day 10.
The strong cold/coldest on the planet keeps showing up on all ensemble means in W Canada source region while the US is very mild.
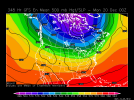
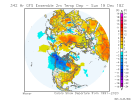
So, the message remains that the ante is likely going to be way up as far as cold potential for the C US within 2 weeks and the E US within 3. Dec will almost certainly end up a very mild month in the E US. I’ve got my shorts ready. That’s been known for a few days. The uncertainty is for afterward.
The strong cold/coldest on the planet keeps showing up on all ensemble means in W Canada source region while the US is very mild.


So, the message remains that the ante is likely going to be way up as far as cold potential for the C US within 2 weeks and the E US within 3. Dec will almost certainly end up a very mild month in the E US. I’ve got my shorts ready. That’s been known for a few days. The uncertainty is for afterward.
Last edited:
NBAcentel
Member
Webberweather53
Meteorologist
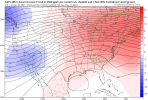
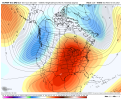
End of 12Z GEFS suggesting drastic pattern change quite possible late month:
View attachment 96933
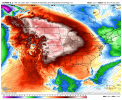
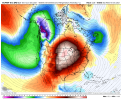
And look at how cold is the W Canada source region that could easily be tapped, especially if the MJO cooperates:
View attachment 96935
I think the GEFS has the right idea, but it's likely much too progressive w/ handing off the MJO into the W Hem which speeds up the pattern change vs what it probably would/should be. I think we probably wait until at least the last week of December/after Christmas for significant & consistent changes for the better.
Webberweather53
Meteorologist
NBAcentel
Member
Always too progressive…im January 15th or after…minimum.I think the GEFS has the right idea, but it's likely much too progressive w/ handing off the MJO into the W Hem which speeds up the pattern change vs what it probably would/should be. I think we probably wait until at least the last week of December/after Christmas for significant & consistent changes for the better.
LukeBarrette
im north of 90% of people on here so yeah
Meteorology Student
Member
2024 Supporter
2017-2023 Supporter
L
Logan Is An Idiot 02
Guest
Congrats roxboroView attachment 96941
Better than nothing
accu35
Member
LukeBarrette
im north of 90% of people on here so yeah
Meteorology Student
Member
2024 Supporter
2017-2023 Supporter
So weak all of the suddenWeird okay View attachment 96943
Webberweather53
Meteorologist
Weird okay View attachment 96943
Generously 15 mins of a light rain sleet mix
D
Deleted member 609
Guest
- Joined
- Jan 23, 2021
- Messages
- 4,548
- Reaction score
- 15,033
- Location
- Lebanon Township, Durham County NC
I made that map myself. You’re welcome.Weird okay View attachment 96943
In a sea of red this is a diamond in the roughGenerously 15 mins of a light rain sleet mix
If you could expand it south I'd appreciate itI made that map myself. You’re welcome.
NBAcentel
Member
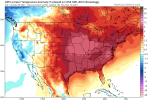
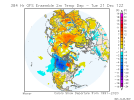
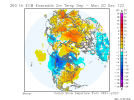
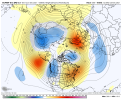
Interesting how there are almost no negative heights at all in Eurasia. We have seen many winters before in the last 10 years where North America had none of the blues, and Russia and Europe had all of it. I guess that is the one good thing we have going for us, so when it does arrive it will be plenty cold.The extreme cold/coldest anomalies on the planet continues to show in our primary source region of W Canada at the end about every ensemble run and is poised to plunge down into the US once the MJO gives its ok:
12Z EPS
View attachment 96951
Webberweather53
Meteorologist
Lagged MJO phase composite evolution and NWP suggest the way we break out of this pattern is via -NAO. You can see the precursor signs of it setting up over Scandinavia and northern Africa + Mediterranean on the EPS & GEFS and slow moving MJOs like this one are more likely to trigger -NAOs barring it actually moves into the W hem. Probably still no less than a week, maybe two from this point in the model from a legit favorable pattern change, but that's generally consistent w/ what I've been thinking for the last week or so timing-wise.
Also we'll have to keep an eye on that vortex over NE Siberia (+WPO), if that extends eastward more towards the Aleutians, it could set off a -EPO in the late portion of the month &/or early January.
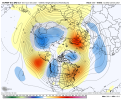
Also we'll have to keep an eye on that vortex over NE Siberia (+WPO), if that extends eastward more towards the Aleutians, it could set off a -EPO in the late portion of the month &/or early January.

NBAcentel
Member
NBAcentel
Member
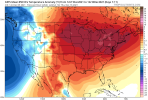
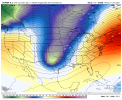
Well at least the cold will be closer, in the western/central US vs Canada, lol #babystepsLagged MJO phase composite evolution and NWP suggest the way we break out of this pattern is via -NAO. You can see the precursor signs of it setting up over Scandinavia and northern Africa + Mediterranean on the EPS & GEFS and slow moving MJOs like this one are more likely to trigger -NAOs barring it actually moves into the W hem. Probably still no less than a week, maybe two from this point in the model from a legit favorable pattern change, but that's generally consistent w/ what I've been thinking for the last week or so timing-wise.
Also we'll have to keep an eye on that vortex over NE Siberia (+WPO), if that extends eastward more towards the Aleutians, it could set off a -EPO in the late portion of the month &/or early January.
View attachment 96950
tennessee storm
Member
Dumpster fire ? ….yeah this pattern is trash lol, looks like the EPS was headed for a -EPO and was fixing to dump the cold out west, maybe trying to get some + heights towards the Arctic tho View attachment 96953
Interesting how there are almost no negative heights at all in Eurasia. We have seen many winters before in the last 10 years where North America had none of the blues, and Russia and Europe had all of it. I guess that is the one good thing we have going for us, so when it does arrive it will be plenty cold.
Those are 2 meter temps rather than heights but your point is spot on with by far the largest area and most intense cold right in our primary source region waiting for the MJO to get its ass over to the left side.
NBAcentel
Member

