Prognostic Discussion for 6 to 10 and 8 to 14 day outlooks
NWS Climate Prediction Center College Park, MD
300 PM EST Tue December 13 2022
6-10 DAY OUTLOOK FOR DEC 19 - 23 2022
There is fair agreement for the
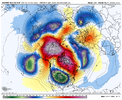
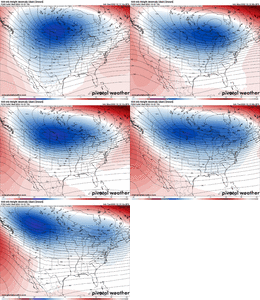
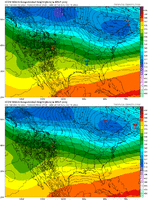
500-hPa height pattern among the dynamical
models today. An area of negative height
anomalies is maintained over much of
the contiguous U.S. (CONUS) with the strongest departures in the upper Midwest.
Tools have begun to build positive height
anomalies into parts of the western
CONUS. The tools are in agreement for positive anomalies, however there is
disagreement for the strength of these
anomalies and their exact position. The
GEFS maintains a strong connection with positive height
anomalies centered in
the Arctic and through Alaska during the period. However, the European and
Canadian both offer a more southward height solution, developing a new height
center off the Pacific Coast of the
CONUS and more distinct separation between
the developing height center and the center in the Arctic. This impacts the
model’s precipitation patterns, particularly over the Pacific Northwest and
Alaska Panhandle. In Alaska, positive
500-hPa height
anomalies remain over
nearly the entire state with a
ridge axis splitting the state east-west
although this axis has shifted slightly further west relative to yesterday.
Despite the minor disagreement in
500-hPa heights, overall, tools are in good
agreement for the temperature pattern across much of the country. In Alaska,
ahead of the
ridge axis, southerly flow aloft is likely to bring above normal
temperatures to parts of western Alaska and the Aleutian Islands. Meanwhile,
across the eastern Mainland and Panhandle, below normal temperatures are
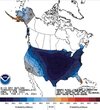
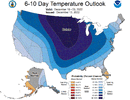
favored. In the Lower-48, nearly the entire
CONUS is favored for below-normal
temperatures during the 6-10 day period. Exceptions are southern portions of
the Florida Peninsula and Northern Maine. This is a long-duration, high impact,
cold event that is likely to introduce bitterly cold temperatures to much of
the United States. Separately, in California and the Southwest, probabilities
for below-normal temperatures have eased relative to previous forecasts,
indicating chances for a warming trend by the end of the period. However,
across the eastern
CONUS chances have only increased further as tools continue
to agree on below-normal temperatures.
In the eastern CONUS, the
500-hPa trough has a strong influence on the
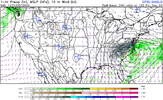
precipitation pattern during the period. At the base of the trough, the
southern stream may bring a series of storms increasing chances for
above-normal precipitation along the Gulf Coast. Below-normal precipitation is
favored for much of the middle Mississippi, Tennessee, and Ohio River Valleys
beneath the center of the
trough. Above-normal precipitation is slightly
favored near the Great Lakes where lake effect and lake enhanced snow may occur
with the potential for Alberta clipper systems to develop and swing through the
Northern Tier. There is disagreement between the tools for precipitation across
the West. European based tools are much wetter in the Pacific Northwest
compared to GEFS based tools as a result of the differences in the
500-hPa
height pattern. Nevertheless, GEFS based tools have grown wetter compared to
yesterday and near-normal is favored today for the immediate coast with slight
chances for above-normal along the Cascades. Further south, tools remain in
good agreement for dryer conditions and below-normal precipitation is favored.
In Alaska, much of the state is forecast to have below-normal precipitation
with strong positive
500-hPa height
anomalies. An exception is across parts of
southern and western Mainland Alaska where onshore flow brings slight chances
for above-normal precipitation.
The official 6-10 day
500-hPa height
blend consists of 10% of Today's 0z
GFS
Ensemble Mean centered on Day 8, 30% of Today's 6z
GFS Ensemble Mean centered
on Day 8, 40% of Today's 0z European Ensemble Mean centered on Day 8, and 20%
of Today's 0z Canadian Ensemble Mean centered on Day 8
FORECAST CONFIDENCE FOR THE 6-10 DAY PERIOD: Above-Average, 4 out of 5, Due to
good agreement among tools across much of the forecast domain.
8-14 DAY OUTLOOK FOR DEC 21 - 27 2022
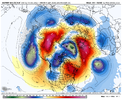
Dynamical models are in good agreement during week-2 for strong negative
500-hPa height
anomalies across the eastern
CONUS and rising heights across the
western
CONUS with continued positive height
anomalies across much of Alaska.
During week-2 dynamical tools forecast two positive
anomaly centers, the first
over the Arctic Ocean, and a second in the eastern Pacific off of the coast of
California and Oregon. In the Gulf of Alaska, the positive height
anomalies
weaken somewhat in the European and Canadian tools while the GEFS continue to
maintain a strong connection through Alaska. However, looking at the daily
evolution of the tools, the GEFS appears to come into better agreement with the
other models by the end of the period.
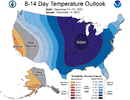
Temperatures are favored to be below-normal across most of the Lower-48 states
during the week-2 period. Strongest probabilities remain over the Midwest and
Northern Plains but chances are high over a vast area with greater than 60%
odds from the Rocky Mountains, to the Gulf Coast and up into New England. An
exception to the below-normal temperatures is across California and parts of
Nevada where positive height
anomalies appear to be building, increasing
chances for above-normal temperatures. In Alaska, below-normal temperatures
remain favored in the Panhandle while above-normal temperatures are favored
across the southwestern portions of the Mainland and Aleutian Islands.
Above-normal precipitation is favored across the Gulf Coast and stretching
towards the Mid-Atlantic. Dynamical models continue to show chances for storm
systems to develop in the Gulf of Mexico and to progress up the East Coast
during week-2. Meanwhile, below-normal precipitation remains favored for the
Middle Mississippi, Tennessee and Ohio River Valleys. Lake effect snow chances
keep precipitation chances near-normal in parts of the Great Lakes. Meanwhile,
upslope flow along the Rockies favors above-normal precipitation. Below-normal
precipitation is favored for Southern California and the Southwest as the
positive height
anomalies continue to limit precipitation. North of California,
models are showing increased chances for onshore flow to develop and the
Integrated Water Vapor Transport (IVT) tool indicates increased chances for
precipitation. Above-normal is favored much of the Pacific Northwest. In
Alaska, relative to the 6-10 day period, there are increased signals for
increased precipitation along much of the southern Coast of Alaska, including
the Panhandle. The Panhandle is likely to see a significant pattern shift by
the middle to end of the week-2 period. Meanwhile, below-normal precipitation
is slightly favored across the Northeast.
The official 8-14 day
500-hPa height
blend consists of: 10% of Today's 0z
GFS
Ensemble Mean centered on Day 11, 20% of Today's 6z
GFS Ensemble Mean centered
on Day 11, 50% of Today's 0z European Ensemble Mean centered on Day 11, and 20%
of Today's 0z Canadian Ensemble Mean centered on Day 11
FORECAST CONFIDENCE FOR THE 8-14 DAY PERIOD: Above-Average, 4 out of 5, Due to
good agreement among the tools but with some decreased confidence with a lack
of run-to-run continuity.
FORECASTER: Ryan Bolt
Notes:
Automated forecasts are issued on Saturday and Sunday. Occasionally manual
intervention is necessary to address quality control and consistency issues. In
these cases, forecasts are manually drawn but a full discussion is not issued.
The notation for the categorical forecast indicated on the maps is the same as
that in the tables: A-above N-near normal B-below
The temperature map shows regions with > 33% chance of being warmer (orange,
"A"), colder (blue, "B"), or close to (unshaded, "N"). Historical average
values for the calendar period of the forecast (dashes, "f"). Labels on the
shaded lines give the probability (> 33%) of the more likely category (B or A).
Probability of N is always < 40%.
The precipitation map shows regions with > 33% chance of being wetter (green,
"A"), drier (tan, "B"), or close to (unshaded, "n"). Historical median values
for the calendar period of the forecast (dashes, "inches"). Labels on the
shaded lines give the probability (> 33%) of the more likely category (B or A).
Probability of N is always < 40%.
In the southwest and other climatologically dry regions - there will be a
greater than 33.3% chance of no precipitation and occasionally even a normal
(i.e. Median) value of zero - especially during the dry seasons. In such cases
a forecast of near normal is effectively a forecast of little or no
precipitation.
The climate prediction center uses 1991-2020 base period means as reference in
the climate outlooks.
The next set of long-lead monthly and seasonal outlooks will be released on
December 15.
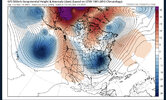
Analogs to the 5 day mean observed pattern centered 3 days ago (D-3)
for the region from 20N to 70N latitude and 175E to 60W longitude
include the 5 day periods centered on the following dates:
19681217 - 20031226 - 19991210 - 19941206 - 19921213
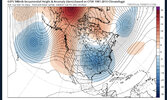
Analogs to the 7 day mean observed pattern centered 4 days ago (D-4)
for the region from 20N to 70N latitude and 175E to 60W longitude
include the 7 day periods centered on the following dates:
19681217 - 19921213 - 20031226 - 19731122 - 19871214

