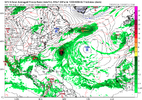
• Hello, please take a minute to check out our awesome content, contributed by the wonderful members of our community. We hope you'll add your own thoughts and opinions by making a free account!

Tropical 2024 Tropical Thread Reboot


CSU outlook for next 2 weeks: most likely near normal with activity more concentrated in 2nd week as one would expect based on models; no surprises in this. They did well with their prior 2 week fcast, which verified mainly due to Ernesto with its favoring of above avg activity

12Z GEFS: still rather active for first few days of Sept.
 
Last edited:
Euro weeklies mean ACE forecast update vs norm last 7 days (newest far right, which is 0Z of Tue):

8/26-9/1: 50%/60%/50%/50%/50%/30%/20%; Norm 14
9/2-8: 110%/110%/120%/100%/110%/70%/70%; norm 15
9/9-15: 90%/80%/90%/80%/100%/80%/90%; norm 16
9/16-22: 90%; norm 13

So, in today’s Euro Weeklies update regarding the 3 weeks I’ve been following, yesterday’s progged sharp mean ACE drop from 40 to 28 was maintained today. Also, todays added a new week (9/16-22) with a mean of 12 ACE.

Thus, today’s Euro Weeklies mean ACE prediction for the 4 week period 8/26-9/22 is 40. This 40 compares to the 1991-2020 avg of 58. So, mean ACE prediction is significantly below the 1991-2020 avg mainly due to weeks 1-2 fwiw.
Thoughts?

Even those numbers sound too high. The MDR is shut down for the season so any storms will have to come from either nontropical origins(no sign of that this season) or somehow a dry wave somehow manages to develop. Those will be few and far between. I think we will also have an early shutdown of the season. Time to wait till july 25 2025 for possible weather. Its sad to see Knabb on TWC still trying to seel that the season is going to snap to life after a week. He can see the same things we see but of course he is under pressure to keep ratings up.

18Z GFS ends with the MT even more upside down with waves coming off at 23N. Debby part2 dropped. Ominous showers in the GOM

1724196539503.png

This may be a record. The next wave may be coming off Africa at 27N


1724205334515.png
 
Last edited:
At 240 the 0Z EURO shows not even a weak depression. It does show a wave that again comes off too far north and of course isnt going to develop. 0Z GFS is dead thru sept 06 now.

1724224412248.png


As long as the MT is upside down no wave is going to develop coming off at 20N. Until that changes the season hinges on stalled fronts and upper lows. We are blowing thru the season peak.
 
Last edited:
GFS totally dead. Anoher wave coming off at 20N. I keep reading they are going to start coming off further south. December?


1724239257604.png
 
Its Climate Change Fault! ( JK) . Im in Gawx camp. As much as I get obsessed with weather of all types, ( minus Heat/drought). LF Canes I'd prefer not to see. Unlike a blizzard, you wrap up if power goes out and it melts away a few days latter. Flood waters getting into folks houses is a no bueno and way to costly.
 
Its Climate Change Fault! ( JK) . Im in Gawx camp. As much as I get obsessed with weather of all types, ( minus Heat/drought). LF Canes I'd prefer not to see. Unlike a blizzard, you wrap up if power goes out and it melts away a few days latter. Flood waters getting into folks houses is a no bueno and way to costly.
Winter weather by far takes a larger human toll and costs billions a year
 
wxman57 sticks another dagger in the season

wxman57 » Wed Aug 21, 2024 7:34 am

"I found a comparison between this time in 2023 vs. now using the NHC 7-day outlook graphic so I made my own. Quite a difference. After August 19 in 2023, there were 3 storms that formed in late August, 6 in September and 2 in October. That's 11 named storms after August 19th. This year, nothing. Unlikely we'll see any additional storms in August and early September is looking dead, too. We could reach the peak of the season (Sept 10) with only 5-6 named storms. I love it! Days off this time of year are a luxury.

I read Klotzbach's season update but I think something is being missed. Warm water - check. Low wind shear - maybe. As for a favorable environment - nope. Caribbean and Tropical Atlantic are dominated by dry, sinking air. It doesn't matter how warm the water is. If the atmosphere isn't favorable then hurricanes struggle to develop. I'm thinking my revised numbers of 18/8/4 may be too high. I'm just hoping for the current pattern to continue and any additional storms to stay out to sea. Perhaps those global models indicating no development are correct. Looking for an ensemble member somewhere to indicate development? Ha!"
 
Car accidents,heart attacks from shoveling snow and hundreds of thousands of injuries from slipping on snow and ice cause massive amounts of problems.
Hurricanes cost per year- around 1B over 10k deaths
winter weather per year- 750M- about 19k deaths since 1979
per National Center of Environment information.
 
1980-2022
Tropical cyclones have caused the most damage ($1,333.6 billion) and have the highest average event cost ($22.2 billion per event). Drought ($327.7 billion), severe storms ($383.7 billion), and inland flooding ($177.9 billion) have also caused considerable damage based on the list of billion-dollar events.

Severe storms have caused the highest number of billion-dollar disaster events (163), but they have the lowest average event cost ($2.4 billion). Tropical cyclones and flooding represent the second and third most frequent event types (60 and 37), respectively. Tropical cyclones are responsible for the highest number of deaths (6,890), followed by drought/heatwave events (4,275) and severe storms (1,982).


1724246413347.png


1724246552496.png
 
"Our analog seasons were all very active Atlantic hurricane seasons," Klotzbach said in the news release. "This highlights the somewhat higher level of confidence that exists with this outlook relative to our typical early August forecast."

The team at CSU predicts that the 2024 hurricane activity will be about 190% of the average season from 1991-2020.

"By comparison, 2023's hurricane activity was about 120% of the average season," CSU said.

Oops
 
Back
Top