Bingo!I’m guessing a cold start to December can only mean it’s gonna be in the 70s when Christmas comes.
See 2002 December ice storm! Then winter was over
Bingo!I’m guessing a cold start to December can only mean it’s gonna be in the 70s when Christmas comes.
Yes, I like the idea of getting it over now with the holidays. January can warm up since we will all be ready for spring by thenBingo!
See 2002 December ice storm! Then winter was over
Who is we ?? lolYes, I like the idea of getting it over now with the holidays. January can warm up since we will all be ready for spring by then
December Dud? More like Dynamite December.

What??? After the December 2002 Ice Storm, there were 3 more good storms in January and February 2003Bingo!
See 2002 December ice storm! Then winter was over
Only my absolute favorite snowstorm of all timeWhat??? After the December 2002 Ice Storm, there were 3 more good storms in January and February 2003
My way too early & honest overall impression of this upcoming winter based on these analog years (whose SST composite is posted above) is we might be in for quite a roller coaster ride across much of the CONUS & N America.
The La Niña, warm Tropical West Pacific, west QBO, & high solar combo is usually one that favors a strong + poleward shifted Aleutian ridge, w/ more frequent bouts of -EPO/-WPO that occasionally seed North America w/ brutally cold air from Siberia, although the Nina-induced SE US ridge may resist its southward progression at certain points. The prevalence of a -EPO/-WPO this winter seems to be showing up time & time again.
Oth, signals are pretty mixed over the North Atlantic & polar cap, though a -NAM/-AO/-NAO is slightly favored if anything. I generally agree w/ that based on recent history of -ENSO winters & how things are starting to unfold leading into this winter and what some of the indicators are (like high solar + west qbo + La Niña) that normally in conjunction are more conducive to sudden stratospheric warming events.
In terms of modern winters, years like 2013-14 & 1988-89 really seem to stand out as some of the best analogs compared to the rest of the pack.
View attachment 151080
View attachment 151079
The month-to-month variability in this composite of years is honestly wild. Says a lot about where I think we might be headed this year. Sure, I think a milder-than-average winter is likely in the cards for us in the southern tier of the CONUS, but how we get there doesn't exactly look straightforward at all. Even if our mean temps are warmer-than-average (which I think they'll probably be this year), there should going to be enough cold air floating around in our general vicinity (N American continent) for legitimate opportunities at wintry weather to come knocking if we briefly line a few things up. Couldn't necessarily say that about last winter for the most part.
December
View attachment 151081
January
View attachment 151084
February
View attachment 151083
March
View attachment 151082


Updated this analog list to include things like Indian Ocean & Maritime Continent warmth, initialize w/ a +TNH in Dec (because when this happens oftentimes that TNH pattern persists throughout the winter), stronger than average zonal winds at 10mb in Dec, tweaked the weights, etc. I got a slightly different flavor to things, but the overall picture is generally the same as before, just amplified a bit more.
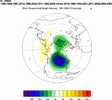
Here's how the gigantic (list of 350 years in total w/ weights) SST composite compares to observations in Oct-Nov. Of course only the first 25-30 or so are in the title, but there are a lot more in the background.
View attachment 154609
View attachment 154610
Here's the DJF 500mb mean pattern & 2m temp anomalies.
View attachment 154611
View attachment 154612
Interestingly, both this suite of analogs & the older set I came up with back in October sniffed out a cold December w/ a -EPO/+TNH. This new set is more amplified, in part because I explicitly looked for it this time, because a +TNH is likely going to happen.
Older analog set Dec 500mb pattern
View attachment 154614
Newer analog set Dec 500mb pattern.
View attachment 154613


Sounds goodThis is one of those winters where I think a strat warm event would actually hurt us (potentially). I just don't want to lose the stratosphere support over top of the Hudson Bay vortex.
La nina conditions. Or scale tipped in La nina favor as opposed to a neutral state (no el nino or la nina)Meaning

Better hope it's correct. 4-6 are very warm phasesMaybe we don't get stuck in the warmer phases after all?
View attachment 155521
Maybe we don't get stuck in the warmer phases after all?
View attachment 155521
Just in time for Santa moving to January. Let's hope so.Takes 20 days to get to phase 7. Oof
Nothing certain yetBetter hope it's correct. 4-6 are very warm phases
Just in time for Santa moving to January. Let's hope so.


Just out of curiosity, what are you considering a winter storm here? Any precipitation with a temp at or below 32, measurable snow, snow > 1” or something else? Also, do these stats include the mountains?RMM MJO Phase 7-8 in cold ENSO is usually the hot spot for getting a winter storm in NC.
View attachment 155534
January phase 7 in general is the true hot spot for getting a winter storm in NC, with a 1 in 6 chance per day of seeing snow/ice. This is about 3x higher than climo
View attachment 155535
Just out of curiosity, what are you considering a winter storm here? Any precipitation with a temp at or below 32, measurable snow, snow > 1” or something else? Also, do these stats include the mountains?
Good deal. I did a similar study myself around 2018 and found the same results so I was curious if your methodologies were similar, which they were.Any storms that are archived on my website where measurable snow/ice occurred outside the mountains, (>Trace snow or T or greater ZR) or cases where measurable snow or ice occurred at RDU, CLT, GSO, ILM, FAY, or ECG (when I don’t have a storm archived).
I made these a few years ago and posted them right before Jan 2022 happened
Good deal. I did a similar study myself around 2018 and found the same results so I was curious if your methodologies were similar, which they were.
I remember when I used to have “professional development” days where I could do fun SQL-based studies like this. Apparently I developed too much, because I don’t have much free time anymore lol.NOAA ESRL has provided an OLR based MJO index that goes back to 1940 using ERA-5 reanalysis. Might be worth giving that a try when I get a chance and have some time on my hands
NOAA ESRL MJO indices
Is there a reason you like the Hudson Bay vortex? Maybe historically speaking that can produce here?, but I feel like the last 10-15 years it has been absolute garbage for getting wintry weather.This is one of those winters where I think a strat warm event would actually hurt us (potentially). I just don't want to lose the stratosphere support over top of the Hudson Bay vortex.