When and where? I didn’t see no run that show that.FWIW not that it is at all but every Gfs run for a little bit have had a similar looking set up for a winter storm in the medium to long range ... interesting but noise
-
Hello, please take a minute to check out our awesome content, contributed by the wonderful members of our community. We hope you'll add your own thoughts and opinions by making a free account!
You are using an out of date browser. It may not display this or other websites correctly.
You should upgrade or use an alternative browser.
You should upgrade or use an alternative browser.
Miserable March
- Thread starter GaWx
- Start date
NBAcentel
Member
This At H5 I think is what he’s referring to.When and where? I didn’t see no run that show that.

NBAcentel
Member
As much as I'd love this to be real, I assume this is mainly due to the GEFS doing what it does best or worst. But does it have to be completely off its cold biased rocker? I ask because of cold March analogs and the fact that this is only 252 hours out rather than near the end of the run. Also, there is a +AAM then, which does partially correlate to a +PNA. So, at least this offers some hope. IF this were just halfway real, it would mean only 3 day torch 3/3-5 in between cold periods.
By the way, though 2/27-8 are still about as cold on the GFS as what it had a few days ago, 2/29-3/1 have warmed considerably! For example,
KATL had been 44/27 and 52/28. Now it is way up at 51/33 and 61/37! Cold bias ftl. This is why it is always wise to assume cold bias in cold GFS maps and hope for the best..
View attachment 36367
View attachment 36369
It’s worth noting there’s been a trend at H5 to getting rid of the SER around that time, so it may not be crazy, maybe we can have a last chance for something outside the mountains with this

Brent
Member
I'm going to NY next week and gonna be in Boston this day for this one night lmao not holding my breath on this verifying though given how winter has been up there(I think I saw about the same amount of snow the other week in Wichita Falls that Boston has seen since January....)

Last edited:
Well, what do you know. I may have to go back to Majestic March if this keeps up. The models have been taking away from the cold of 2/29 and 3/1 as well as from 3/2-3 and are more than giving it back during 3/5-9. The 0Z EPS deserves a holy wow for 3/5-9. It is the -PNA/warm favoring combo of MJO 4/5 and +AO vs the +PNA/cold favoring +AAM. It looks like the +AAM is trying to take over here.
Note how much further east is the E Pacific ridge as of 3/4 on today’s 0Z EPS vs yesterday’s 0Z EPS: note how much higher the heights are on the W coast, which leads to a stronger and much further east trough in the Midwest on the new run accompanied by much higher sfc pressures coming in. As a result later on, look at what we have, a +PNA!

This then leads to solid BN to MB in the SE on 3/7! The run from 24 hours ago had slightly warmer than normal then!!

Note how much further east is the E Pacific ridge as of 3/4 on today’s 0Z EPS vs yesterday’s 0Z EPS: note how much higher the heights are on the W coast, which leads to a stronger and much further east trough in the Midwest on the new run accompanied by much higher sfc pressures coming in. As a result later on, look at what we have, a +PNA!
This then leads to solid BN to MB in the SE on 3/7! The run from 24 hours ago had slightly warmer than normal then!!
Writing has been on the wall for this for a while. The models did the reverse head fake this time and showed warm then back to cold. Im not sold on us being out of the woods for snow potential eitherWell, what do you know. I may have to go back to Majestic March if this keeps up. The models have been taking away from the cold of 2/29 and 3/1 as well as from 3/2-3 and are more than giving it back during 3/5-9. The 0Z EPS deserves a holy wow for 3/5-9. It is the -PNA/warm favoring combo of MJO 4/5 and +AO vs the +PNA/cold favoring +AAM. It looks like the +AAM is trying to take over here.
Note how much further east is the E Pacific ridge as of 3/4 on today’s 0Z EPS vs yesterday’s 0Z EPS: note how much higher the heights are on the W coast, which leads to a stronger and much further east trough in the Midwest on the new run accompanied by much higher sfc pressures coming in. As a result later on, look at what we have, a +PNA!
View attachment 36377
This then leads to solid BN to MB in the SE on 3/7! The run from 24 hours ago had slightly warmer than normal then!!
View attachment 36378
I came across an interesting thread from HM (Anthony Masiello) on Twitter regarding some evidence on why this winter has been so warm and to why the pattern ended up the way it did to date.
In HM's tweet, he focuses on two pieces of the Pacific jet stream. Both Jets are visualized in his second tweet, where the North Africa-Asia (NAA) jet is on the left and the East Asia North Pacific (EANP) jet is on the Left.
Each jet's strength and the relationship between each other has proven to be indicative of the upper-level pattern. Referring to tweet #3, when the atmosphere leaned towards a +NAA and a -EANP, we leaned towards a +AO and little blocking and overall zonal (Warm air flowing into the middle latitudes) pattern. With a -NAA and a +EANP, the atmosphere reacts, per contra with a -AO and more blocking. Note that this theory only applies when one jet was above average and one was below, so it does not apply to every winter.
Another thing that the strong jet does, is lead to where MJO will set up. The MJO is part of a Hadley cell, with a widespread area of rising energy. Personally, I'm not sure if the Hadley cell impacts the jet or vice versa, maybe @Webberweather53 can chime in. To continue, with the stronger jet, depending on the area, the MJO stays in certain phases based on which jet is stronger wrt their locations. If the NAA jet is stronger, then phases 4-5-6 are more likely. If the EANP jet is stronger phases 7-8-1 are more likely where the MJO is in RED with rising air and Blue is sinking air.

This winter, we saw a strong +NAA jet (The fourth highest) and a-EANP referencing Tweet #2. In layman's terms, Because the Jetstream was strong over Africa and Weak over Asia, forcing favored a more Zonal flow with a +AO and bad MJO phases.
In HM's tweet, he focuses on two pieces of the Pacific jet stream. Both Jets are visualized in his second tweet, where the North Africa-Asia (NAA) jet is on the left and the East Asia North Pacific (EANP) jet is on the Left.
Each jet's strength and the relationship between each other has proven to be indicative of the upper-level pattern. Referring to tweet #3, when the atmosphere leaned towards a +NAA and a -EANP, we leaned towards a +AO and little blocking and overall zonal (Warm air flowing into the middle latitudes) pattern. With a -NAA and a +EANP, the atmosphere reacts, per contra with a -AO and more blocking. Note that this theory only applies when one jet was above average and one was below, so it does not apply to every winter.
Another thing that the strong jet does, is lead to where MJO will set up. The MJO is part of a Hadley cell, with a widespread area of rising energy. Personally, I'm not sure if the Hadley cell impacts the jet or vice versa, maybe @Webberweather53 can chime in. To continue, with the stronger jet, depending on the area, the MJO stays in certain phases based on which jet is stronger wrt their locations. If the NAA jet is stronger, then phases 4-5-6 are more likely. If the EANP jet is stronger phases 7-8-1 are more likely where the MJO is in RED with rising air and Blue is sinking air.
This winter, we saw a strong +NAA jet (The fourth highest) and a-EANP referencing Tweet #2. In layman's terms, Because the Jetstream was strong over Africa and Weak over Asia, forcing favored a more Zonal flow with a +AO and bad MJO phases.
I came across an interesting thread from HM (Anthony Masiello) on Twitter regarding some evidence on why this winter has been so warm and to why the pattern ended up the way it did to date.
In HM's tweet, he focuses on two pieces of the Pacific jet stream. Both Jets are visualized in his second tweet, where the North Africa-Asia (NAA) jet is on the left and the East Asia North Pacific (EANP) jet is on the Left.
Each jet's strength and the relationship between each other has proven to be indicative of the upper-level pattern. Referring to tweet #3, when the atmosphere leaned towards a +NAA and a -EANP, we leaned towards a +AO and little blocking and overall zonal (Warm air flowing into the middle latitudes) pattern. With a -NAA and a +EANP, the atmosphere reacts, per contra with a -AO and more blocking. Note that this theory only applies when one jet was above average and one was below, so it does not apply to every winter.
Another thing that the strong jet does, is lead to where MJO will set up. The MJO is part of a Hadley cell, with a widespread area of rising energy. Personally, I'm not sure if the Hadley cell impacts the jet or vice versa, maybe @Webberweather53 can chime in. To continue, with the stronger jet, depending on the area, the MJO stays in certain phases based on which jet is stronger wrt their locations. If the NAA jet is stronger, then phases 4-5-6 are more likely. If the EANP jet is stronger phases 7-8-1 are more likely where the MJO is in RED with rising air and Blue is sinking air.
View attachment 36404
This winter, we saw a strong +NAA jet (The fourth highest) and a-EANP referencing Tweet #2. In layman's terms, Because the Jetstream was strong over Africa and Weak over Asia, forcing favored a more Zonal flow with a +AO and bad MJO phases.
That is hard for me to follow. I have been given a much simpler explanation, which may incorporate some of what you posted. Recent SE winters have been warm largely due to the very warm W Pacific waters, which lead to a higher % of winter days in MJO 4 and 5 (favoring stronger SER), along with some help from GW. If we want to reduce the frequency of warm SE winters, a relative cooling of those waters vs surrounding waters would in theory help a lot although that would be way easier said than done.
pcbjr
Member
Well, something of interest down this way ...

During the fall there was decent reason to believe the winter would be Pacific dominated and the Atlantic would provide minimal help. I personally never would have seen us having positive anomalies in the okhotsk region and near AK. I'm pretty certain the congealed strong pv didnt do us a lot of favors this winter either. It seemed like any time we got any semblance of poleward ridging going it was chopped off and failed. Its really a case of what could have been. If we flip the positive anomalies in the sea of okhotsk negative and force the Pacific ridge poleward we would have had at least a shot at a multi week period of epo driven cold combined with stj moisture. Instead we got the +okhotsk heights a flat Pacific ridge and a SE/EC ridge reflectionThat is hard for me to follow. I have been given a much simpler explanation, which may incorporate some of what you posted. Recent SE winters have been warm largely due to the very warm W Pacific waters, which lead to a higher % of winter days in MJO 4 and 5 (favoring stronger SER), along with some help from GW. If we want to reduce the frequency of warm SE winters, a relative cooling of those waters vs surrounding waters would in theory help a lot although that would be way easier said than done.
.gif")
Last edited:
Nomanslandva
Member


Nomanslandva
Member
Closer view for Wed. GFS and CMC have it to a lesser degree too.

Downeastnc
Member
These Euro wind maps are almost always overdone by 10-20 mph....the values for the mts might be close but I would take 10-20 mph off everywhere else....though being a wind junkie I hope its right....
Yeah. I'm expecting gusts in the 15-25 mph range, based on this map.These Euro wind maps are almost always overdone by 10-20 mph....the values for the mts might be close but I would take 10-20 mph off everywhere else....though being a wind junkie I hope its right....
Nomanslandva
Member
Here, sometimes the models in the short range are really close but sometimes things just never mix so they are way over done. We have issues here with NW flow events because the cross barrier and down slope aids in transfer. I just don't think I have ever seen this with what looks like it would be a S or SW wind event. We get occasionally get a rouge gust from this direction but nothing that looks this widespread.These Euro wind maps are almost always overdone by 10-20 mph....the values for the mts might be close but I would take 10-20 mph off everywhere else....though being a wind junkie I hope its right....
Downeastnc
Member
Here, sometimes the models in the short range are really close but sometimes things just never mix so they are way over done. We have issues here with NW flow events because the cross barrier and down slope aids in transfer. I just don't think I have ever seen this with what looks like it would be a S or SW wind event. We get occasionally get a rouge gust from this direction but nothing that looks this widespread.
For here the bigger wind days from mixing are usually anywhere from NW around to SW ( any big wind here with a east component usually means tropical system ) but typically the max gust on days like that are 35-45 mph its pretty unusual to get over 45, though we had that day a few weeks back where the airport here PGV recorded a 54 mph gust.
NBAcentel
Member
Actual real Spring pattern is in sight on the GFS at the end of the run, believe it or not, gefs supports it that far out, rare 


NBAcentel
Member
Spring pattern showing up more on the models dominated by ridging but troughs swinging in around Canada allowing possible transient CAD setups, yep, that sounds like a springtime pattern to me ! Winter is slowly fading guys 


B
Brick Tamland
Guest
I guess it's about time to start looking forward to chasing severe weather.
Oops sorry.Wrong thread
Nomanslandva
Member
EURO still off the rails with wind next week. Even worse. Make the dead March thread great again

Oh that’s a just a 104mph wind gust at Newfound Gap..EURO still off the rails with wind next week. Even worse. Make the dead March thread great again
View attachment 36469
Downeastnc
Member
EURO still off the rails with wind next week. Even worse. Make the dead March thread great again
View attachment 36469
Not just the Euro the GFS also has winds well into the 50-70 mph range over a lot of SC-VA, there is a big high offshore and strong low so the gradient will be packed in but still this is overdone and we probably are realistically looking at peak gust to around 50 being much more likely assuming this setup plays out as modeled.


Nomanslandva
Member
What's that overlook over there near Pisgah? Graveyard or something. It is an old blowover site where the decaying root balls of the trees now looks like a cemetery. Some crazy wind event many years ago caused that.Oh that’s a just a 104mph wind gust at Newfound Gap..
Graveyard Fields. There was a fire there many many years ago that wiped out all of the trees and growth. There are new trees now. The types of trees seen there now tend to shed their leaves sooner than the rest of the trees down the parkway. That coupled with the high elevation is why you can ride up to graveyard fields several weeks before peak foliage to see the leaves beginning to turn and fall. I went in October and it was magical.What's that overlook over there near Pisgah? Graveyard or something. It is an old blowover site where the decaying root balls of the trees now looks like a cemetery. Some crazy wind event many years ago caused that.
Winter is slowly fading guys
Wait, did we actually ever have winter?
Wait, did we actually ever have winter?
Didn’t Sandy Springs actually get accumulating snow? I saw it all along I-285 on north side via traffic cams.
Last edited:
ATLwxfan
Member
Writing has been on the wall for this for a while. The models did the reverse head fake this time and showed warm then back to cold. Im not sold on us being out of the woods for snow potential either
About an inch which melted by midday. Higher amounts to the north.
Sent from my iPhone using Tapatalk
NoSnowATL
Member
Didn’t Sandy Springs actually get accumulating snow? I saw it all along I-285 on north side via traffic cams.
Do you mean this?

I’m above average for snow for once so this winter has been great.
Sent from my iPhone using Tapatalk
Do you mean this?

I’m above average for snow for once so this winter has been great.
Sent from my iPhone using Tapatalk
No, I don’t mean what you got. I’m talking about @SSGa hometown of Sandy Springs after he asked “What winter?”
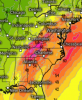
I’m posting this from the 12Z Euro not because I believe it but just for the record (the run is much colder than the prior run, which is good reason to not believe it and think it is overdone as even the Euro has had a significant cold bias recently): note that amounts under 1/2” don’t show here

Yeah the Euro sure tried to make it interesting....

ForsythSnow
Moderator
So the euro is later and colder, and further south than the GFS, the ICON is suppressed to nowhere, and the CMC is similar to the GFS but north. Quite interesting the Euro has strong storms and temps in the 40s in N GA vs the GFS's 60s and storms.
"The 15-Day forecast totals 294.3 GWHDDs, ranking 14th fewest for the period among records dating back to 1950. It is warmer than normal and over the same period a year ago (388 in 2019 ranked 10th coldest for the period). The forecast resides on the warm side of model consensus, with only the 18z GFS OP projecting a lower total over the past 24 hours. All models have been cold biased of late, particularly in the near term. Monday’s 0z run for the Monday to Thursday period saw our forecast missing by 0.3 GWHDDs, while cold errors from the models include the GFS OP by 2.7, the Euro OP by 4.7, the Euro EN by 6.0, the GFS EN by 6.8 and the CAN EN by 12.5." from Maxar this morning
The cold bias never ends.
The cold bias never ends.
Ron Burgundy
Member
We got an inch in Sandy Springs ITP. Lost about half to melting, but even still the trees were coated and roads were covered for a few hours . All in all it was a nice event given the unlikeliness of how it all came together and how sucky the winter had been to that point. No complaints from me!No, I don’t mean what you got. I’m talking about @SSGa hometown of Sandy Springs after he asked “What winter?”
Cold biased or not it’s interesting to see the euro trending towards something interesting in the medium range ... definitely much different from earlier solutions shown.. I guess this goes without saying but this time period needs to be watched ?
Surprised this place is so dead with the way models have started trending in the medium range ... maybe one last hurrah setting up ... then again everyone here is probably drained with disappointment.. I know I am .. it’s hard to try and hope one more time
NBAcentel
Member
?
