Shaggy
Member
I mean that big beautiful blob of rain and all I get is .14 as it did that weird splitWe can all suck together
I mean that big beautiful blob of rain and all I get is .14 as it did that weird splitWe can all suck together
I mean that big beautiful blob of rain and all I get is .14 as it did that weird split
We can all suck together

It works for all seasons nowadays
Meanwhile I’ve had to grow more cold hardy winter vegetables since the cold has gotten them the last two years. But my hardiness zone went to 8a as well. #agendaI actually emailed our local NWS (FFC) and asked them how they justified the KATL weather stations jumping around between the hours of 1 and 4PM as much as 5 or 7 degrees in the matter of minutes. My $300 tempest performs better then their sorry excuse of a weather station. Averages were 2-4 degrees higher then the immediate reporting stations in the vicinity. They throw out some basic basic excuses, and when you don't buy it, they get less responsive. I also emailed one of our local mets who is now retired, a huge GW pusher, and he didn't like me pointing it out either. I've gone through all the ten year averages at our local reporting stations, and its only the main airport stations show significant increases. KPDK was actually cooler some months in the latest 30 year averages, and it should actually be warmer as it is a more urban environment then KATL.
I also sent a pretty lengthy email to the agency that puts out the hardiness zone map asking for specific criteria as to why my zone in particular went from 7b to 8a.
"I live in norther Georgia, specifically Cobb County. What was the data used to move our area from 7B to 8A? Specifically which reporting stations? The reason I ask is NOAA is not reliable in our area, and the main reporting stations at the regional airports have become exceptionally egregious with overall temperatures, specifically overnight lows. It has gotten so bad now that I can’t help wonder why it isn’t investigated. The station at KATL (Hartsfield Jackson) is now averaging around 3 degrees warmer then KPDK, both deeply embedded in the same urban heat island less than 20 miles apart and similar elevation. My area is now in region 8A, 10-15F, what is the criteria for that? Is it a percentage of years within a ten year period of having lows that reach that range? From 2014-2023 the closest reporting station that FCC actually provides access to (Dallas, GA www.weather.gov) was 9 degrees or less 12 times in 5 of those 10 years, or winter seasons. Maybe I’m just not understanding the methodology of how the zones are actually determined. The two reasons I’m inquiring about this is: where is the data coming from, and what is the criteria for putting certain areas in temperature zones? It must be some sort of average, because obviously it isn’t determinative."
No response, of course.
Lol, come on you guys. Those hardiness zones are based on average coldest temperature, not records. There's no agenda, they are what they are, and they are meant as a helpful guide for planters. It sounds like you were planting vegetables that were risky for your zone, you just got away with it for years.Meanwhile I’ve had to grow more cold hardy winter vegetables since the cold has gotten them the last two years. But my hardiness zone went to 8a as well. #agenda
Generally cut 4 to 5 degrees is usually good. KFFC mentioned in their recent AFD that the globals were coming in too hot and even the NBM was too hot.
CAE and FLO both reached 101 today, RDU and CLT 97. GSP 95. Mtns were the place to be, AVL only reaching 87.
Generally cut 4 to 5 degrees is usually good. KFFC mentioned in their recent AFD that the globals were coming in too hot and even the NBM was too hot.
Yeah, what I'm finding the fatal flaw of the GFS's ridiculously high temps is how it mixes out the boundary layer... IE, dropping dewpoints/RH's value ridiculously low. Probably also assuming the ground is baked as well.


Fabulous fall, with the MJO in phases 8,1,2 through October!The winter sucked summer sucks... What's next
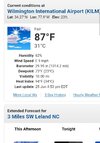
I don't think that 65.7 dewpoint is accurate. I'm seeing dewpoints in the 40s in Newnan.96 at my house and not a cloud anywhere. Sizzling! Dewpoint is 65.7 and RH is 37%.
I don't think that 65.7 dewpoint is accurate. I'm seeing dewpoints in the 40s in Newnan.

Correct me if I’m wrong, but hasn’t the HRRR had a bias to mix out dewpoints way to much?Here is the 6Z HRRR temperature map for 19Z (3PM EDT) tomorrow showing many non-mountain/non-coastal locations of VA/NC/SC/GA 101-104:
View attachment 148119
Here is the 6Z HRRR dewpoint map for the same hour showing the same locations with 43-58 dewpoints:
View attachment 148120
Comparing to NWS forecasts, these HRRR temperatures are several degrees hotter and dewpoints are significantly cooler. The HRRR dewpoints of 43-48 in the Charlotte, NC, to Macon/Columbus, GA, corridor look especially way too low. I’ll compare to reality tomorrow to see how well this HRRR run ends up verifying with temperatures/dewpoints in these 4 states’ non-mountain/non-coastal locations. I expect this run will verify with temperatures several degrees too hot most locations and dewpoints significantly too cool most locations.
Correct me if I’m wrong, but hasn’t the HRRR had a bias to mix out dewpoints way to much?
I just went and looked back and the HRRR has definitely been wanting to mix out dewpoints too much. For example yesterday’s 12z run of the HRRR was putting my dewpoint right now at 60 and it’s currently at 68, which is a noticeable improvement over the last several days in the mid 70s.I don’t know as this is the first time I’ve ever looked at HRRR dewpoints. But it wouldn’t surprise me looking at that map with 40s dewpoints from Columbus to Charlotte. The GFS at least appears to have that bias on sunny summer afternoons in the SE.
Regardless, those are some unusually low late June dewpoints in much of the E US. Not here though where we have very muggy upper 70s!
We also have the east wind which helped drop the temp from 91 down to 87 but DP stayed elevatedDewpoint dropped to 55 here on a east to se wind which is odd this time of year...
Not sure snow would stick to the roads tonight
Yes big timeCorrect me if I’m wrong, but hasn’t the HRRR had a bias to mix out dewpoints way to much?
Yeah rates will not overcomeNot sure snow would stick to the roads tonight