-
Hello, please take a minute to check out our awesome content, contributed by the wonderful members of our community. We hope you'll add your own thoughts and opinions by making a free account!
You are using an out of date browser. It may not display this or other websites correctly.
You should upgrade or use an alternative browser.
You should upgrade or use an alternative browser.
Pattern June 2024
- Thread starter SD
- Start date
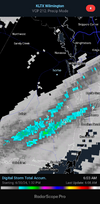
Looks like it rained a lot in Sampson county
Shaggy
Member
Seeing some estimates approaching 13 inches just west of salemburgLooks like it rained a lot in Sampson county
I got another .62 inches from the thunderstorms that went through my neck of the woods last night around 10:00 PM to give me a sum of .64 inches. The rain certainly wasn't a drought buster but it was welcome none the less. Now I'll enjoy the cooler temperatures for the next couple of days and wait for the heat to return and the potential for more rain this weekend.
Last edited:
Ended up with 2.13 via multiple rounds. Probably best case scenario here and hopefully buys time if and until we get a pattern change.
Bannerdude
Member
Most of the storms missed to the north yesterday's so I only had .20" before midnight. Did manage another .80" after midnight though to get exactly 1" from the entire event. Total June rainfall was 0.42"
June 2024 finished 6th warmest and 13th driest for CHA going back to 1879. Can't wait to see my water bill.
Just below a half inch at my location (last 24hrs). Much better than I thought would happen late yesterday afternoon.
Didn't get a storm but finally got some rain last night. Today's weather was a nice break from the extreme heat.