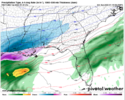
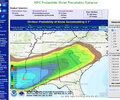
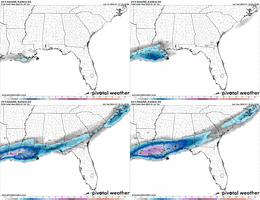
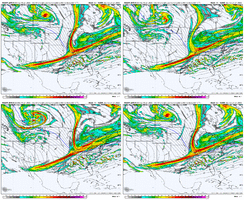
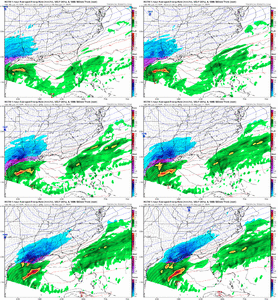
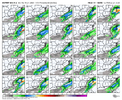
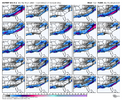
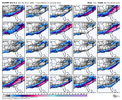
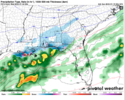
I am worried that something like the ARW suite is affecting the NBM output.
-
Hello, please take a minute to check out our awesome content, contributed by the wonderful members of our community. We hope you'll add your own thoughts and opinions by making a free account!
You are using an out of date browser. It may not display this or other websites correctly.
You should upgrade or use an alternative browser.
You should upgrade or use an alternative browser.
Wintry January 21-23 2025
- Thread starter SD
- Start date
Was about to post this much larger swath NE with slug of moisture and orientented ti get more people in the mix
NBAcentel
Member
The rgem is way weaker with the northern stream in general but it’s seemingly giving more space
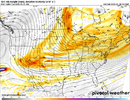
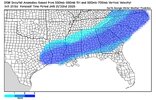
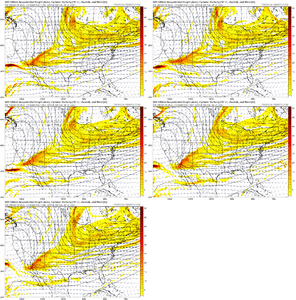
They are showing frontogenesis and waa at the 700 and 850mb levels. You basically want some orange over your house along with purple circles. The more purple circles the higher likelihood of heavier precipCan you explain what these plots are showing? Webb showed them earlier and mentioned a further extension of the precip field but I would like to understand them a bit more. Thanks.
ChattaVOL
Member
Does anyone have the RAP?
Sent from my iPhone using Tapatalk
Sent from my iPhone using Tapatalk
Pivotalweather dot com does. Along with pretty much every other model. Only goes out to 48 on a few runs.Does anyone have the RAP?
Sent from my iPhone using Tapatalk
NBAcentel
Member
beanskip
Member
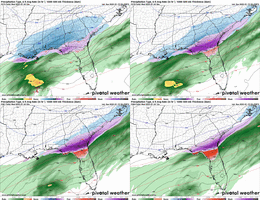
Wait, what is the RGEM doing? It just sleets over north Florida/SE Ga. for 12 straight hours and still hasn't stopped at the end of the run. 1.6 inches of QPF?
GeorgiaGirl
Member
SnowDoomer21
Member
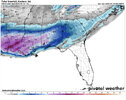
Thru Tuesday eveningView attachment 165325
What is it basing that north trend off of I don’t get it??
Sent from my iPhone using Tapatalk
NBAcentel
Member
Probably because this short range model gets first dibs on obs and data each run hence why it might be useful in a setup like that and this oneEnd of run:
View attachment 165329
It's going to be more useful Monday as I believe this was the main model that fired the warning that most of the models were wrong on the upper end of the precip back with Jan 2014.
Either way that current RAP run's 500mb sucks for much of a banger downstream. I can't let go of a neutral tilt. Dang it.
I wish I knew I would assume that the euro ticking up may be leaning it vs the gfs suire looking badI seen this asked before, but didn’t see the response. How is the NBM still increasing if all the major models decreasing in the northern areas?
beanskip
Member
The NBM does not have any of these major model suites coming in tonight on it yet. Someone posted the charts earlier, but I think the ARW/WRF type members, the ones that were screwing up the SREF mean, are doing the same here. Can't be 100% without a real datasheet though.
NBAcentel
Member
Got caught in a ---- central where the northern stream backed off some but it’s to close by and the wave is still to strung. Either need to back it off more and tilt the base with the kicker or go back to slowing the northern streamThis was unexpected -- I know it's the end of the RGEM's range, but sheesh.
I don’t know what a Doncane is, but you have convinced me. I shall worship it.View attachment 165332Doncane has spoken.
View attachment 165332Doncane has spoken.
What is this
albertwilsonjr
Member
Why does it just stop
Sent from my iPhone using Tapatalk
Cad Wedge NC
Member
Looks like the dry cold wedge eats up the moisture.Why does it just stop
Sent from my iPhone using Tapatalk
Not bad up this way, it is something I watch closely and during last storm it had lower amounts iirc 1-2" consistently and that is where we ended up. I have no idea why it's beefed up amounts today in the face of all others decreasing. I've read and reread some points in that powerpoint and honestly I can't figure out exactly what models are used, during what hours and with what weight. LolHow did the NBM overall do last time? I'm curious as to how it's showing such a large streak in N GA where the more recent models barely touch it. It seems a bit off to me but could make sense if there's a strong lean into a far NW trend with a potential phase.
A small entry from the NBM v4.1 tech sheets as an example:
Maybe there is more somewhere here: https://vlab.noaa.gov/web/mdl/nbm-documentation
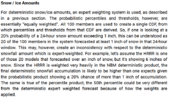
Maybe there is more somewhere here: https://vlab.noaa.gov/web/mdl/nbm-documentation

beanskip
Member
Pac low is south of 18z position through 33 hours of 0z GFS while the n/s is a good bit west of 18z position.
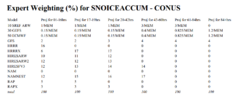
Has to be, but as far as I can tell at this lead time the GFS, GEFS and Euro are the heaviest weighted models in there. Still doesn't make sense to meI wish I knew I would assume that the euro ticking up may be leaning it vs the gfs suire looking bad
A small entry from the NBM v4.1 tech sheets as an example:
Maybe there is more somewhere here: https://vlab.noaa.gov/web/mdl/nbm-documentation
View attachment 165336
RobertRath
Member
What would lead to the L riding higher across the gulf? Simply a weaker H pressure or something more?
Tokenfreak
Member
Charleston Meteorologist thinking for the low country
Don Trey's fake model that he hand draws in MS paint and calls a model.What is this
albertwilsonjr
Member
Sent from my iPhone using Tapatalk
BKWRN29
Member
Need that precip to keep expanding east!
WEATHERBOYROY
Member
They may be making a conclusion outside of total model output. They may not be looking at the precip maps so much, but the 700mb moisture and upper atmospheric energyHas to be, but as far as I can tell at this lead time the GFS, GEFS and Euro are the heaviest weighted models in there. Still doesn't make sense to me

