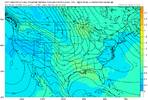
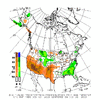
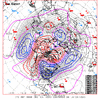
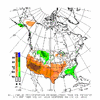
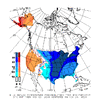
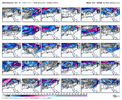
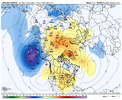
You really can’t ask for a better look than the GEFS at hr 270.
-
Hello, please take a minute to check out our awesome content, contributed by the wonderful members of our community. We hope you'll add your own thoughts and opinions by making a free account!
You are using an out of date browser. It may not display this or other websites correctly.
You should upgrade or use an alternative browser.
You should upgrade or use an alternative browser.
Pattern Dazzling December
- Thread starter Rain Cold
- Start date
Usmeagle2005
Member
Wondering how it moves coming through (if it comes through) Mississippi. I’ll take it thought.Whole board pretty much wins with lucky number 7
This is how you like a good winter storm to progress in the SE … a while of pattern recognition and model waffling .. as you get closer with time the pattern seems more absolute.. snow mean begins showing up but nothing aggressive.. a possible fail in modeling (slight panic) .. progressing snow means on all global model ensemble means .. then a slow uptick in these as we get closer. Let’s cross our fingers we can cash in this December boys and girls.
mydoortotheworld
Member
I’m pulling for the bouncycorn wave, at least for N GADefinitely lots of support for the Bouncy Corn wave. Great track as well for most of the board.
View attachment 125887
griteater
Member
So I'm experimenting a bit with putting in graphical form the number of ensemble members that show a winter storm over 2 day periods
Here is the area that I used for determining whether the member was a winter storm hit (sorry for those to the west, etc). I simply viewed the precip type maps that showed all of the ensemble members, and I kept a tally of each winter storm hit (snow or ice) in this blue zone.

Here is what I came up with for the 12z model runs - GEFS / CMCE / EPS. So, we can see from this run that the most hits showed up for Dec 22-23. The total number of hits for Dec 22-23 was 27 of the 100 ensemble members across all 3 models (i.e. 27% of the members showed a winter storm for Dec 22-23).

A few things:
1. I didn't count upslope snow in the mountains
2. I didn't count rain storms that ended as some snow
3. I didn't count weak storms with skiffs of snow
4. I didn't count the operational or control runs in the total
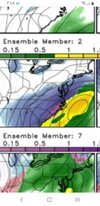
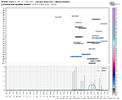
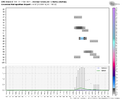
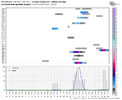
This is the type of ensemble member precip type output that I reviewed for determining the numbers (this image is from the new 18z GEFS - I see some have already been posted)

Here is the area that I used for determining whether the member was a winter storm hit (sorry for those to the west, etc). I simply viewed the precip type maps that showed all of the ensemble members, and I kept a tally of each winter storm hit (snow or ice) in this blue zone.

Here is what I came up with for the 12z model runs - GEFS / CMCE / EPS. So, we can see from this run that the most hits showed up for Dec 22-23. The total number of hits for Dec 22-23 was 27 of the 100 ensemble members across all 3 models (i.e. 27% of the members showed a winter storm for Dec 22-23).

A few things:
1. I didn't count upslope snow in the mountains
2. I didn't count rain storms that ended as some snow
3. I didn't count weak storms with skiffs of snow
4. I didn't count the operational or control runs in the total
This is the type of ensemble member precip type output that I reviewed for determining the numbers (this image is from the new 18z GEFS - I see some have already been posted)

Great info there… thanksSo I'm experimenting a bit with putting in graphical form the number of ensemble members that show a winter storm over 2 day periods
Here is the area that I used for determining whether the member was a winter storm hit (sorry for those to the west, etc). I simply viewed the precip type maps that showed all of the ensemble members, and I kept a tally of each winter storm hit (snow or ice) in this blue zone.

Here is what I came up with for the 12z model runs - GEFS / CMCE / EPS. So, we can see from this run that the most hits showed up for Dec 22-23. The total number of hits for Dec 22-23 was 27 of the 100 ensemble members across all 3 models (i.e. 27% of the members showed a winter storm for Dec 22-23).

A few things:
1. I didn't count upslope snow in the mountains
2. I didn't count rain storms that ended as some snow
3. I didn't count weak storms with skiffs of snow
4. I didn't count the operational or control runs in the total
This is the type of ensemble member precip type output that I reviewed for determining the numbers (this image is from the new 18z GEFS - I see some have already been posted)

I’m spending Christmas in San Antonio with my sisters family so if you ask the 12z or 18z, I win either way.bro i have seen a lot of gfs runs in my day keeping tabs on wilmington and i have never seen that town be in play for three coastals on one single run lmao
edit:
tired: man it would be shame if richmond got creamed while i was visiting my folks in wilmington
wired: i gotta get to wilmington as soon as possible no way im missing this
if there's a 1989 redux i levitate into heaven
whatalife
Moderator
griteater
Member
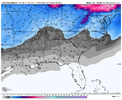
Gefs loaded, like a bigstick and Logan Elliot diaper ! View attachment 125907View attachment 125908
Holy guacamole! Even the small events as modeled have a great track.
I think something else needs to be said, if the modeled snow pack on the GEFS verifies, we are gonna be looking at blistering cold. The models won’t resolve that at this range.
That's a fairly decent low they got over there in the Aleutians.
griteater
Member
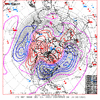
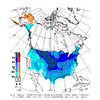
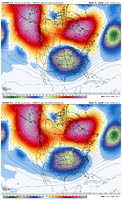
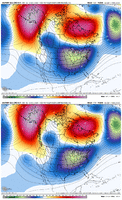
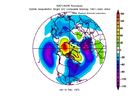
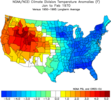
So -4 and -5 departures for a two month avg,is kind of a big thing??Closest comparison I dug up for that big ridge ball above Alaska was Jan-Feb 1970 (Jan 1970 was on Fro’s CPC analog list)
View attachment 125927
View attachment 125928

