Wow. Definitely got a dusting in a hurry under that band. Wasn't expecting that
-
Hello, please take a minute to check out our awesome content, contributed by the wonderful members of our community. We hope you'll add your own thoughts and opinions by making a free account!
You are using an out of date browser. It may not display this or other websites correctly.
You should upgrade or use an alternative browser.
You should upgrade or use an alternative browser.
Wintry 01/28-29/2022 Winter Weather Potential
- Thread starter weather nerd
- Start date
Showmeyourtds
Member
Was not expecting the pavement to be wet here, much less snow-covered. Wild stuff
A dusting too but my friend in Peachtree City got alot more based off his picture on FB!Wow. Definitely got a dusting in a hurry under that band. Wasn't expecting that
Snowflowxxl
Member
I’ve seen snow on four different occasions this month for a total of 0.5 inches. This is gonna be a tough winter to grade ?
It is so beautiful outside though!I’ve seen snow on four different occasions this month for a total of 0.5 inches. This is gonna be a tough winter to grade ?
Got under a heavy band. Covered up everything instantly. Moderate + big flakes for a change
 Pretty epic bust by the hrrr good lord
Atlantic City area getting crushed 
Oh okay .. heavy flurries now sigh 
Attention Delta Dog, Macon incoming alert!
Big W for the Atlanta crew
Yep @deltadog03 incoming

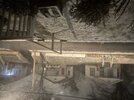
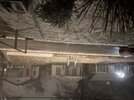
Everything got white except the roads which are wet. It’s 31 right now so it may not be long before these wet streets start to get icy. I took these near the tail end of that snow band moving out.
Attachments
I've lived in this area(Cobb/Paulding counties), aside from a few years in Columbia, SC, since 2003. Almost every time we have a sharp trough like this we end with either flurries, snow showers, usually north of 20 and west of 400. I was a little surprised the models weren't showing this a couple of days ago, but maybe they were and I wasn't paying close enough attention.
Thats awesome, congrats! It should hang around in shady spots most of the morning tomorrow.Everything got white except the roads which are wet. It’s 31 right now so it may not be long before these wet streets start to get icy. I took these near the tail end of that snow band moving out.
Wow setting up right over me … is this a mirage .. this is a decent snow shower 
RAP did a pretty good job with this. Pretty spot on actually.I've lived in this area(Cobb/Paulding counties), aside from a few years in Columbia, SC, since 2003. Almost every time we have a sharp trough like this we end with either flurries, snow showers, usually north of 20 and west of 400. I was a little surprised the models weren't showing this a couple of days ago, but maybe they were and I wasn't paying close enough attention.
That band on the NW of Atlanta has been expanding! Let's see what it do!RAP did a pretty good job with this. Pretty spot on actually.
Snowing
SouthSideYankee
Member
Moderate snow here
Lol sideways flizzard 35F

Mesoscale Discussion 0096
NWS Storm Prediction Center Norman OK
1101 PM CST Fri Jan 28 2022
Areas affected...New Jersey coastal areas...central and eastern Long
Island...and parts of southeastern New England coastal areas
Concerning...Heavy snow
Valid 290501Z - 290900Z
SUMMARY...Heavy snow will continue to develop near northern Mid
Atlantic into southeastern New England coastal areas, including much
of Long Island, through 3-5 AM EST. Heaviest snow rates up to 2
inches per hour may focus near southern New Jersey coastal areas
through around 1-3 AM. Increasing, gusting surface winds probably
will lead to increased potential for reduced visibilities, blowing
and drifting of snow toward daybreak.
DISCUSSION...The offshore surface cyclone is beginning to deepen
more rapidly, and recent runs of the Rapid Refresh indicate 2-3 mb
per hour deepening may continue into the 09-10Z time frame before
slowing a bit. To the northwest of the northward migrating center,
a coinciding tightening of the surface pressure gradient is forecast
across southeastern New England coastal areas and Long Island into
southern New Jersey. This will be accompanied by strengthening
east-northeasterly to northeasterly low-level wind fields, including
an intensifying jet around 850 mb (to 40-50 kt) by 10Z, and further
strengthening thereafter.
Large-scale ascent, aided by strengthening lower/mid tropospheric
frontogenetic forcing, near the northwestern periphery of a plume of
moistening air (including precipitable water increasing to around
.5+ inches) near coastal areas, appears likely to maintain moderate
to heavy snow rates generally up to around 1 inch per hour. Rapid
Refresh forecast soundings suggest that, in response to stronger
frontogentic forcing in the 700-500 mb layer, lift may become
maximized in the dendritic growth zone across southern New Jersey
coastal areas (around Atlantic City) through 06-08Z, possibly
supporting hourly snow rates on the order of 1.5-2 inches.
Although the snow may be relatively "heavy and wet", as surface
winds begin to strengthen and gust in excess of 35-40+ kt
overnight, blowing and drifting of snow, along with occasionally
sharply reduced visibilities, will become an increasing concern
toward daybreak.
..Kerr.. 01/29/2022

Downtown was a white out! Gorgeous!
Feeling like a dumb*** for standing outside at 1am but I have flurries. Goodnight and f the HRRR
TigerStrong
Member
LOL us Charlotte peeps got punked on this oneFeeling like a dumb*** for standing outside at 1am but I have flurries. Goodnight and f the HRRR
dsaur
Member
I love it when this happens. Hadn't paid any attention to the weather all day and night, just that it was getting colder, and smelled like snow. And I go out at 1:30 am and everything is covered in snow, lol. Must have been an energetic burst to put down this much. Sorry I missed it.
Honestly getting some good snow right now .. a dirty dusting is what I’m getting at the moment
I just stepped outside and saw some
flakes flying!!Attention Delta Dog, Macon incoming alert!
Light snow. All of it seems to be melting and not accumulating.
SimeonNC
Member
The snow and wind is picking up here. Went for a walk to clear my head and it went from barely noticeable flurries to a flizzard.
Sent from my LM-Q730 using Tapatalk
Sent from my LM-Q730 using Tapatalk
I can’t say I’m not liking radar trends first time all night saying that
Snow now coming down hard enough to actually stick and we’re getting close to freezing
Wow already have a coating .. where did this come from
Coming down pretty good here right now not pants busting explosion worthy but still beggars cant be choosers
Let's ride giddy upWow already have a coating .. where did this come from
Oh yea radar starting to look real good, flakes getting bigger
Coming down good with this to show right now .. this is impressive snow though 
