NBAcentel
Member
For some perspective, this ridge would still give us above average heights even if it happened in July

View attachment 97100
It’s beginning to look a lot like Christmas! This is the CFS mind you
Don’t think most realize how insane thisWell before any chance for the cold to return in a big way, we’ll have this for our outdoor pleasure per 12Z GEFS: look at that ridge for the 30 member ensemble mean!
View attachment 97105
If it wasn’t for this week this would easily be top 3 warmest December’sDon’t think most realize how insane this
Look is in dec
This week isn’t much BN, the mid 70s (near and over 20F AN ) on Saturday and very warm low temps the end of the week might still put us at + for the week by Sunday lolIf it wasn’t for this week this would easily be top 3 warmest December’s

That actually looks a little scary. Can’t even see any of nc lolholy ?

Ensembles don’t support itHere it is boys. Columbia special, right where we want it at 384 hours.
View attachment 97106
I've been playing around with the data. I'm interested in seeing the snow distribution for each phase based on geographical area as well. The only concern I have is that the sample size is so small as some phases only have a couple of snow events.I honestly should strongly consider making my own MJO composites (including ones for lags, phase speed, etc) and update some of those other plots for Miller As and Bs on my webpage. Think I can make the plots look a lot nicer and use better reanalysis datasets (ERA-5 instead of NCEP-R1 for ex).
God knows they need it.California is enjoying this.

I've been playing around with the data. I'm interested in seeing the snow distribution for each phase based on geographical area as well. The only concern I have is that the sample size is so small as some phases only have a couple of snow events.
Merry Flamin TorchmasView attachment 97120
Do you have a source for the parameters that define the RMM MJO? I have worked on slicing data over a certain region, which you could use to track the MJO from the VP200 over SLP anomalies from that area. I don't know if my thoughts would work as I don't have a full understanding of the dynamics behind the MJO as you do. It gives me a headache thinking about yet again downloading 20MB of data to complete a project like this.Yep, that's the case in many instances, using a 45-60 day sliding centered window around each one could help increase sample size. Another solution would be to just "create" more data, i.e. construct an MJO index based on zonal + upper level winds, VP200, and SLPa that goes back to 1950 in ERA-5, which would afford us an additional 25 years to work w/ than current RMM MJO (1974-2021). Been trying to wrap my head around how to go about doing something like this, but it would be really useful to a lot of people and I think using those parameters is very defensible because they're easier to resolve than OLRa (used in RMM) and VP200a is more closely linked w/ the mid-latitude circulation
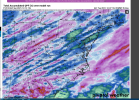
Euro still holds rain, but it comes in sooner, and is out as fast as it comes in.GFS says we are still all systems go for rain Sat / Sun
View attachment 97119


Merry Flamin TorchmasView attachment 97120
Feel like we’re losing the cold look for early January, where as a few days ago, we were looking good, -epo, and all that jazzWe’re not going to get into the cold without first getting into the warmth in this kind of pattern.
Speaking of warmth, the 12Z Euro is also a warmer run.
Do you have a source for the parameters that define the RMM MJO? I have worked on slicing data over a certain region, which you could use to track the MJO from the VP200 over SLP anomalies from that area. I don't know if my thoughts would work as I don't have a full understanding of the dynamics behind the MJO as you do. It gives me a headache thinking about yet again downloading 20MB of data to complete a project like this.
Yep models have moved toward more of a classic SER look with the western trough shifted east vs the central US ridge of a few days ago.We’re not going to get into the cold without first getting into the warmth in this kind of pattern.
Speaking of warmth, the 12Z Euro is also a warmer run. Great news for getting outside and having fun.
Warmth in winter is a lot more tolerable than in summer.We’re not going to get into the cold without first getting into the warmth in this kind of pattern.
Speaking of warmth, the 12Z Euro is also a warmer run. Great news for getting outside and having fun.
