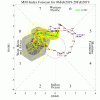
This scenario is unrealistic and unlikely to play out.So. Imagine the FV3 is right. And.. the ice is the real deal while the wedge is stuck in place.
Look at what happens after all that ice has accumulated. Is this a squall line/strong winds?
View attachment 15133
View attachment 15132
-
Hello, please take a minute to check out our awesome content, contributed by the wonderful members of our community. We hope you'll add your own thoughts and opinions by making a free account!
You are using an out of date browser. It may not display this or other websites correctly.
You should upgrade or use an alternative browser.
You should upgrade or use an alternative browser.
Pattern Fabulous February
- Thread starter PEA_RIDGE
- Start date
Chattownsnow
Member
How on gods green earth is the fv3 spitting out 7 inches of snow over Chattanooga? There is no way this set up would have anything more than flurries at the end of the storm for anyone in the Tennessee valley. What is the reason for this amount of snow here and elsewhere in TN?With that amount of ice, even a gentle 10 mph can cause major issues.

Also here's the snow map.

How in the world is the FV3 snow map anywhere close to reality even on pivotal? If this is a strong wedge we are usually looking at sleet and zr mix or more sleet. I'm assuming the pivotal is accounting for sleet as well.
ForsythSnow
Moderator
Worth bringing this up since a lot of modeled ice maps are being thrown around.
I.e. usually a good idea to cut the ice total maps down by 60-75% of course it will vary from case to case.
Seems pivotal uses a ratio double of that. To factor it in realistically, cut the totals in half of what pivotal has I'm guessing. With half an inch in Columbia that's still significant though especially if the model is taken verbatim with a temp of around 28-30 degrees. At very least it could be around 0.4" of ice taken verbatim is my guess.
ForsythSnow
Moderator
It has to do with timing and it is still sketchy. The model output shows the degrade of the wedge not being fast enough, so col air at 850 and 925 are still freezing in that N Central part of GA as the upper cold air wraps in. It's all a matter of position, but it's just model output. It's not meant to be 100% realistic.How in the world is the FV3 snow map anywhere close to reality even on pivotal? If this is a strong wedge we are usually looking at sleet and zr mix or more sleet. I'm assuming the pivotal is accounting for sleet as well.
The last strong wedge to actually bring our area snow was in 2015 I believe. It was a couple inches on top of the sleet we had.It has to do with timing and it is still sketchy. The model output shows the degrade of the wedge not being fast enough, so col air at 850 and 925 are still freezing in that N Central part of GA as the upper cold air wraps in. It's all a matter of position, but it's just model output. It's not meant to be 100% realistic.
snowlover91
Member
NBAcentel
Member
RollTide18
Member
I know it’s not advised to show surface maps but this is crazy


NCSNOW
Member
Checking 12z models just like 6z this a.m. Can,GFS,FV3 all have H5 very similar. Only differences are exact position / timing of HP up over NE. Easy to see this one boys. All about strength/placement /timing of HP in NE.
at 12z noticed the Canadian suite increased HP strength from 12z last night, was 1024 now 1030+. Both GFS and FV3 are 1040+ still. Biggest difference between the 3 globals at 12z is where they place HP. Canadian is fastest out in front sliding off NE with the weaker HP by 10mb. But its trended toward FV3 and GFS.
All 3 solutions viable. Gefs and eps and euro all are similar H5. It gets down to the minuet exact placement , strength of HP. Any little difference has big effects on surface wx down here. Bottom line it is very possible what FV3 shows and very possible its off by just a hair which would yield cold rain.
snowlover91
Member
Seen this story before....
FV3

Euro...

FV3

Euro...

Thor
Member
B
Brick Tamland
Guest
I know everyone is focusing on the 12th and 13th storm on the FV3, but is it still showing two more storms after that before the 22nd?
Euro actually took a step back from 12z yesterday...
Yeah looking at Pivitol, Euro MSLP is worse than it’s 12z run yesterday. Not even close
snowlover91
Member
Checking 12z models just like 6z this a.m. Can,GFS,FV3 all have H5 very similar. Only differences are exact position / timing of HP up over NE. Easy to see this one boys. All about strength/placement /timing of HP in NE.
at 12z noticed the Canadian suite increased HP strength from 12z last night, was 1024 now 1030+. Both GFS and FV3 are 1040+ still. Biggest difference between the 3 globals at 12z is where they place HP. Canadian is fastest out in front sliding off NE with the weaker HP by 10mb. But its trended toward FV3 and GFS.
All 3 solutions viable. Gefs and eps and euro all are similar H5. It gets down to the minuet exact placement , strength of HP. Any little difference has big effects on surface wx down here. Bottom line it is very possible what FV3 shows and very possible its off by just a hair which would yield cold rain.
And the Euro is much weaker with the HP too. The Euro has a 1035mb HP and the GFS/FV3 have a 1042-1045mb one. The Euro is also cutting the low much quicker whereas the FV3 is more suppressed.
tennessee storm
Member
Bring on the severe wx ... western areas of south. Midsouth ...And the Euro is much weaker with the HP too. The Euro has a 1035mb HP and the GFS/FV3 have a 1042-1045mb one. The Euro is also cutting the low much quicker whereas the FV3 is more suppressed.
Which makes sense if the high is indeed weaker, farther NE, and sliding out.And the Euro is much weaker with the HP too. The Euro has a 1035mb HP and the GFS/FV3 have a 1042-1045mb one. The Euro is also cutting the low much quicker whereas the FV3 is more suppressed.
I think when GFS/FV3 come back to reality and lose the 1040+ high we will see a more Euro like solution obviously. These beastly highs rarely work out especially when the king disagrees
GeorgiaGirl
Member
I don't trust the GFS on CAD depiction ever, but it's likely better to side with what the Euro says than hopes and dreams.
snowlover91
Member
Which makes sense if the high is indeed weaker, farther NE, and sliding out.
Correct, the question is which suite will do a better job with the HP strength/speed? The GFS and FV3 both have a slower 1040+ HP and the Euro has a weaker one. It's interesting the FV3 shifted south and maintained the strength of the HP while the Euro was weaker this run.
Ugh still left waiting to see who wants to cave first ... looked like euro was trending toward Fv3 then Fv3 went colder and euro went opposite .. 18z hold strong ??Please
Kylo
Member
Ensembles
If the FV3s depiction of the high is correct, the CAD is probably underdone at this point. But, I'm in agreement that without the Euro onboard, this is a hard one to believe.I don't trust the GFS on CAD depiction ever, but it's likely better to side with what the Euro says than hopes and dreams.
My expectation would be that the Euro would steadily inch toward the GFS if that is the correct solution. That it stepped the other way isn't a good sign. It's not a dagger yet either. We'll have to wait a couple more cycles. By then, we should begin to notice some trends taking shape.Correct, the question is which suite will do a better job with the HP strength/speed? The GFS and FV3 both have a slower 1040+ HP and the Euro has a weaker one. It's interesting the FV3 shifted south and maintained the strength of the HP while the Euro was weaker this run.
If I remember correctly, for the last couple of days, WPC has been throwing out the extended range Euro with it's more progressive look. Fwiw.
snowlover91
Member
I think it's worth noting the GEFS has a WIDE range of possible outcomes in relation to the HP strength/position. I see ones as weak as 1025mb and as strong as 1049mb on this map. The disagreement in both HP strength and location tells me there is a wide range of possibilities and that both the Euro and FV3/GFS ideas are plausible solutions for now.


Last edited:
Webberweather53
Meteorologist
The GFS and FV3 both suffer more from boundary layer decoupling over snowcover even more so compared to the Euro which contributes to the beastly highs on these models vs the more tame Euro solution
MJO still on track to roll around to Phase 8, 1, 2. The Euro actually takes the short route, while the GFS amps it up to ridiculous levels again. If we just blend the two, we should be in Phase 8 in about 10ish days. The models will start to recognize this and "catch up" with their depictions of the pattern. I still expect more ridging to show out west and colder air in the east. The EPO looks to be solidly negative. The PNA is progged to rise to neutral, with some members positive. The AO goes positive and then back toward negative, and the NAO is neutralish. I kind of expect to come in one day and see the PNA shoot positive on the chart, as opposed to slowly heading in that direction over a month.
Overall, I'm still encouraged about where we're headed, even though we're getting toward the end of the season. There's still plenty of time. #backloaded


Overall, I'm still encouraged about where we're headed, even though we're getting toward the end of the season. There's still plenty of time. #backloaded


ForsythSnow
Moderator
It's nice to see we are headed out of the toilet bowl finally. With that look it might be enough to convince me we still have a small chance.MJO still on track to roll around to Phase 8, 1, 2. The Euro actually takes the short route, while the GFS amps it up to ridiculous levels again. If we just blend the two, we should be in Phase 8 in about 10ish days. The models will start to recognize this and "catch up" with their depictions of the pattern. I still expect more ridging to show out west and colder air in the east. The EPO looks to be solidly negative. The PNA is progged to rise to neutral, with some members positive. The AO goes positive and then back toward negative, and the NAO is neutralish. I kind of expect to come in one day and see the PNA shoot positive on the chart, as opposed to slowly heading in that direction over a month.
Overall, I'm still encouraged about where we're headed, even though we're getting toward the end of the season. There's still plenty of time. #backloaded
View attachment 15149
View attachment 15150
It's nice to see we are headed out of the toilet bowl finally. With that look it might be enough to convince me we still have a small chance.
It has snowed in CAE in April before. I understand many think Winter is over as of March 01st, but that's simply not the truth, especially in the upper portions of the SE. There have been some huge events even towards mid March! Anyone in NC remembers a very specific one, in fact.
snowlover91
Member
In case anyone is interested, here is an interesting paper from NOAA on the FV3 performance vs the GFS using 3 specific systems. It's interesting to me that the temperature bias of the FV3 was actually on the warm side through hour 168 whereas the GFS was slightly cold biased in their study. https://www.testbeds.noaa.gov/events/2018/workshop/presentations/(16) Beck_NOAA_Testbed_Workshop.pdf
snowlover91
Member
Here's a link for those interested in comparing the model bias and verification scores. https://www.emc.ncep.noaa.gov/gmb/STATS_vsdb/
ForsythSnow
Moderator
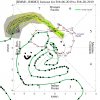
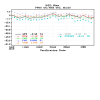
To me the Euro seems to be the most consistent in terms of having the least bias and the CMC seems too highly biased. The FV3 seems to be average a lower bias, so in a sense it's got a slight cold bias at H5. The last couple of days it's been close, but I'd go with the averaging of the biases over the last week or so to get a general idea.Here's a chart showing 5h bias for the major globals through day 5. If I'm reading this correctly it would seem the GFS and FV3 are the two best performing models inside 5 days right now?
View attachment 15151
Six Mile Wx
Member
snowlover91
Member
To me the Euro seems to be the most consistent in terms of having the least bias and the CMC seems too highly biased. The FV3 seems to be average a lower bias, so in a sense it's got a slight cold bias at H5. The last couple of days it's been close, but I'd go with the averaging of the biases over the last week or so to get a general idea.
Here's the chart again, I think I accidentally posted the southern hemisphere one originally. Based on this it would seem the top 3 currently are the Euro, UK and GFS with the FV3 struggling recently.

packfan98
Moderator
I'm a little surprised that they didn't fix the decoupling issue with the new FV3. Is this the same reason that the GFS gets crazy strong with the pressure drops on the hurricanes? It doesn't pick up on what's going on at the surface. Is this something that will be fixed in future years?The GFS and FV3 both suffer more from boundary layer decoupling over snowcover even more so compared to the Euro which contributes to the beastly highs on these models vs the more tame Euro solution
B
Brick Tamland
Guest
GEFS continues to look good. Nice mean and a couple of big hits for NC.
ForsythSnow
Moderator
Yeah that makes a difference. Also that shows the FV3 really is garbage at H5 with a heavy bias a majority of the time and as of lately. With that said, kiss that system goodbye because the FV3 is lost it seems. A -15 bias is quite a large cold bias.Here's the chart again, I think I accidentally posted the southern hemisphere one originally. Based on this it would seem the top 3 currently are the Euro, UK and GFS with the FV3 struggling recently.
View attachment 15153


