• Hello, please take a minute to check out our awesome content, contributed by the wonderful members of our community. We hope you'll add your own thoughts and opinions by making a free account!

Wintry Winter 2024-25 Discussion

Our Mets are not optimistic... Probably because it's been warm and dry lately... If we are headed to La Nina that's gonna be favored

Oh well I'm planning extra snowy trips this year just in case after last winter
 

Thanks for posting.

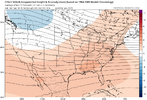
1. WeatherBell CFS maps have been shown to be colder than CFS maps at TT and NOAA, itself, especially in the E US. So, they’re usually misleadingly colder than the real CFS output shows due to programming issues. Note also the strong trough on the W coast. That teleconnects typically with warmth in the SE as I assume you and most here know.

2. Even if WxBell CFS maps weren’t colder than actual output, this has no credibility as it is just one run (0Z 10/3) of an at best mediocre model looking out 3 months. These jump a lot from run to run. The prior run had this ugly map that includes a strong Aleutian ridge:

IMG_0407.png

3. Here’s the average of the last 12 CFS runs from TT showing typical SE ridge:

IMG_0408.png

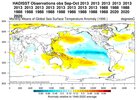
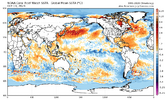
4. I’ll be surprised if 24-5 isn’t warmer than last winter in the SE due to a combo of Niña, strong -PDO/WPAC marine heatwave. Thus I’m already looking ahead to 25-6 for better potential.
 
Last edited:
Our Mets are not optimistic... Probably because it's been warm and dry lately... If we are headed to La Nina that's gonna be favored

Oh well I'm planning extra snowy trips this year just in case after last winter

1. With a strong -PDO/Niña I’d give OK a somewhat higher chance for a non-mild winter than the low chance for the SE. OK and SE sometimes don’t correlate.

2. For the SE the bulk of the hard hit residents (other than ski resort owners) would probably not want a harsh winter during the rebuilding. That’s the positive side of looking at mild winter chances.
 
Thanks for posting.

1. WeatherBell CFS maps have been shown to be colder than CFS maps at TT and NOAA, itself, especially in the E US. So, they’re usually misleadingly colder than the real CFS output shows due to programming issues. Note also the strong trough on the W coast. That teleconnects typically with warmth in the SE as I assume you and most here know.

2. Even if WxBell CFS maps weren’t colder than actual output, this has no credibility as it is just one run (0Z 10/3) of an at best mediocre model looking out 3 months. These jump a lot from run to run. The prior run had this ugly map that includes a strong Aleutian ridge:

View attachment 152499

3. Here’s the average of the last 12 CFS runs from TT showing typical SE ridge:

View attachment 152500

4. I’ll be surprised if 24-5 isn’t warmer than last winter in the SE due to a combo of Niña, strong -PDO/WPAC marine heatwave. Thus I’m already looking ahead to 25-6 for better potential.
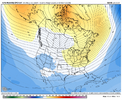
Agreed. I'm leaning towards more of an icy threat in areas that don't need it right now. Wondering if the actual snow axis is going to setup along about TN north with even Virginia fighting temps this year.
 
Don’t know what this guy is smokin, but I want some! IMG_6520.png
 
Our Mets are not optimistic... Probably because it's been warm and dry lately... If we are headed to La Nina that's gonna be favored

Oh well I'm planning extra snowy trips this year just in case after last winter
People were on the bandwagon on very exciting back half of winter last winter, which didn't work too well. It was really more of a niña acting pattern with it being front loaded actually
 
We got lucky last winter Brent. I was surprised it was that cold snowing again. Very rare around my area

Yeah but I never got the big storm I've wanted for 2 years now. Another dusting. At one point the models had 10 inches here from that

Then the February storm would have been it but like the rest of the winter we were 2 degrees too warm. It was just frustrating
 
I can Guarantee you Greensboro will have as much Snow this winter as it had the previous 2 winters Combined. AKA: There's no way to go but up in a positive for winter wx lovers like myself. We want hit rock bottom, cause we've been stationed here for the past 2 years. The only thing that could make it worse, is if it never Frosted all winter.
 
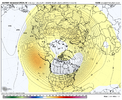
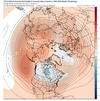
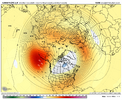
The latest ECMWF, CANSIPS, & CFSv2 seasonal are out, and mostly agree on this upcoming winter being a +TNH style winter, with a poleward shifted/strong Aleutian ridge & big Hudson Bay vortex, very reminiscent of winters like 2013-14 & 1988-89.


ecmwf-seasonal-monthly_avgs-avg-nhemi-z500_anom_season_mostrecent-8368000.png


cfs-mon_01_z500aMean_month_nhem_2.png


cansips-all-avg-nhemi-z500_anom_season_mostrecent-8368000.png


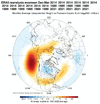
I threw together an analog composite for this winter based on a host of factors & found something very similar to this. Note the 500mb anomaly composite below includes a list of ~200 total years, with some winters like 2013-14 & 1988-89 repeating more than 10x (because they're some of the better analogs for this winter).

Also, if you're someone that frequents NOAA ESRL's compositing page (e.g. @KyloG, @griteater, @GaWx, @1300m ), this NOAA PSL FACTS page is like that but on steroids. You can do so much more in here, like changing the climatological base periods, color scales, and reanalysis datasets & you're also not limited to throwing in just 20 years into a composite. I put a list of 200 years into the one below & it still plotted normally, even though the title only shows the first 28 years in the list I provided.


https://psl.noaa.gov/repository/model/enscompare?frequency=Monthly

https://psl.noaa.gov/repository/alias/facts/

Weighted Winter Analogs 1940-2023 500mb heights.gif

bafkreie2qmarle4ccr4wppswdje4q3fqmhpsotvfp3v5ikngwexeagisbm.jpg


crw_sstamean_global.png
 
The latest ECMWF, CANSIPS, & CFSv2 seasonal are out, and mostly agree on this upcoming winter being a +TNH style winter, with a poleward shifted/strong Aleutian ridge & big Hudson Bay vortex, very reminiscent of winters like 2013-14 & 1988-89.


View attachment 152595


View attachment 152596


View attachment 152597


I threw together an analog composite for this winter based on a host of factors & found something very similar to this. Note the 500mb anomaly composite below includes a list of ~200 total years, with some winters like 2013-14 & 1988-89 repeating more than 10x (because they're some of the better analogs for this winter).

Also, if you're someone that frequents NOAA ESRL's compositing page (e.g. @KyloG, @griteater, @GaWx, @1300m ), this NOAA PSL FACTS page is like that but on steroids. You can do so much more in here, like changing the climatological base periods, color scales, and reanalysis datasets & you're also not limited to throwing in just 20 years into a composite. I put a list of 200 years into the one below & it still plotted normally, even though the title only shows the first 28 years in the list I provided.


https://psl.noaa.gov/repository/model/enscompare?frequency=Monthly

https://psl.noaa.gov/repository/alias/facts/

View attachment 152600

View attachment 152598


View attachment 152599
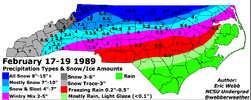
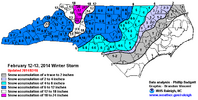
Both 88-89 & 13-14 had some nice February storms.

1728141392599.png

1728141339536.png
 
2013-14 is no doubt a great analog for this winter.


View attachment 152609View attachment 152608
The winter of 2013–2014 was active in North Carolina, with several major snow and ice storms, cold air outbreaks, and freezing rain:


A cold air outbreak on January 7, 2014, caused temperatures to drop into the single digits.

Snow fell on January 21–22, 28–29, and February 12–13, 2014. The February 12–13 storm brought 6–10 inches of snow to much of the region, along with freezing rain.


An ice storm in early March caused more than 350,000 power outages and an estimated $26.9 Freezing rain
Coastal areas, including the Crystal Coast and southern Outer Banks, experienced a lot of sleet and freezing rain.


Many weather stations across North Carolina broke or tied all-time low temperature records. Raleigh recorded -9°F, Charlotte recorded -5°F, Greensboro recorded -8°F, and Asheville recorded -16°F. Mount Mitchell hit -34°F, which was the coldest temperature ever recorded in North Carolina.
 
As I've said before, I try not to get caught up any seasonal forecast. But I do like to read what comes out. Here's one that states we may see more polar vortex disruptions. It doesn't say anything particularly about the SE, but we all remember a couple of years back when a disruption led to colder air primary west of the Apps. But I would think anything different is good.
 
LC:

Although there have been a lot of warmer than normal temperatures during the JJAS summer time frame, and most of the longer term model guidance (ECMWF and CFS glaringly so) predicts a vast field of warmth, using the analog set and the CanSIPS series argues for some cool intrusions in the second half of November. Resisting the urge to use one parameter (and yes it is a low-end La Nina episode we are moving into...), I am leaning toward a warm West vs. cool East alignment next month that will ultimately turn toward a cold Canada and northern 1/2 of the lower 48 states in late December. That Pacific Basin connection, along with likely retrogression and deepening of the Gulf of Alaska Low into a sub-Aleutian vortex, may yet sabe the U.S. from a completely boring DJFM outlook.
I'm OK with predicted above-average southern US predictions so long as we have below-normal air in Canada and the northern US to drive south periodically. A good winter in the SE is rarely wall-to-wall cold but rather a few periods of much below with well-timed precip.
 
I'm OK with predicted above-average southern US predictions so long as we have below-normal air in Canada and the northern US to drive south periodically. A good winter in the SE is rarely wall-to-wall cold but rather a few periods of much below with well-timed precip.

Winter’s my favorite season. No matter the temperatures, it is near guaranteed to be 25+ F colder than summer even down here and with lower avg RH. So, it’s so much better for outdoor activities in my area and in much of the SE since we don’t have harsh winters. We have harsh summers.
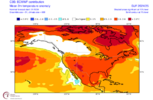
The latest Euro strongly disagrees with the CFS and has mild (AN) in much of Canada and the N US:
IMG_0486.png
 
Last edited:
Winter’s my favorite season. No matter the temperatures, it is near guaranteed to be 25+ F colder than summer even down here and with lower avg RH. So, it’s so much better for outdoor activities in my area and in much of the SE since we don’t have harsh winters. We have harsh summers.
The latest Euro strongly disagrees with the CFS and has mild (AN) in much of Canada and the N US:
View attachment 153235
I sure hope the euro is wrong. That would stink.

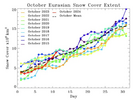
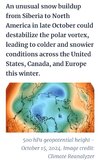
I do see where the Siberian snow cover is running much above normal which Judah Cohen's research correlates with colder-than-average N. American temps. In any case, I take any winter temp anomaly forecasts this far out with a boulder of salt.

1728918172420.png
 
We play this game every year. It’s pretty easy to figure out. We will get a few shots of cold, nothing wall to wall. And hopefully those shots line up with some moisture. Either way it can’t be worse than the last 2 years, right? 😉

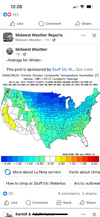
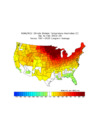
In terms of wintry precip, no. However, it can easily be warmer than last winter when considering that last winter the SE had the coolest relative to normal in the entire E US with near to slightly warmer than normal as per the image below (probably largely thanks to El Niño). Unlike last winter, forecasts/models for this winter have the SE solidly in warmer than normal in rather typical La Niña/-PDO fashion. Regardless of what we get, winter’s my favorite season.

IMG_0487.png
 
Back
Top