I'm just hoping to run out the clock.
-
Hello, please take a minute to check out our awesome content, contributed by the wonderful members of our community. We hope you'll add your own thoughts and opinions by making a free account!
You are using an out of date browser. It may not display this or other websites correctly.
You should upgrade or use an alternative browser.
You should upgrade or use an alternative browser.
Wintry Jan 27-28 Snow Potential Official Thread
- Thread starter RBR71
- Start date
Webberweather53
Meteorologist
18z Euro was actually better slightly overall than the 12z but I'm getting desperate at this pt
Nomanslandva
Member
Wait, it was not that long ago it was 46 up there. dang. Hope I cool that fast...but know I will not.Snow has started on Beech Mountain per web cams. Coming down pretty good.

Teach Lesley
Member
County schools here just went two hour delay. So even when I don’t see any snow here in the morning I will still have that to make me smile. Hard for me to watch it going East of me but good luck to those lucky few.
Still 50 here at 7 pm. And already raining. At what point is it a cold rain. May wait up for that.
Still 50 here at 7 pm. And already raining. At what point is it a cold rain. May wait up for that.
Bannerdude
Member
45/40 in Durham. Was nearly overcast at dusk but clear skies overhead now and noticeably cooling off
B
Brick Tamland
Guest
Down to 44 here
NBAcentel
Member
Gutter flooder  to this
to this Webberweather53
Meteorologist
Gutter flooder View attachment 68603 to this View attachment 68602
That warming in sfc temps near initialization is propagating forward in the runs.
Rip
D
Deleted member 609
Guest
Mild rain incomingDown to 44 here
May have to make significant downward adjustments to my map.
B
Brick Tamland
Guest
Greg Fishel posted this on Facebook 30 minutes ago.
SUPPERTIME UPDATE
Still no reason to steer away from my 2-4" forecast, which I adjusted to at 4AM this morning. Snow is spreading eastward across Kentucky, and we still have a long way to go here in the Triangle before snow can even be entertained as a legitimate word in our vocabulary. At 6pm, the RDU airport reported a temperature of 48 with a dew point of 41. That means that if precipitation were to begin falling heavily right now, the coldest we could get would be about 43 or 44. It's still 40 degrees in Washington, D.C. So again, once we start coming under the influence of the strong upper level wave much later this evening, then that vigorous upward motion will begin to produce significant cooling through a deep layer of the atmosphere, and it's then that the word "snow" can not only be entertained, but welcome with open arms! Starting around 10pm this evening, I'll be doing frequent updates, some text, some video and will continue to provide updates until the system pulls away very late tonight. Hope y'all get my drift LOL.
Avalanche
Member
Looks like rain, especially for northern and eastern Wake.
SouthGarnerSleet
Member
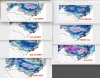
07z has been the steady hour of change to snow for the Wake area. This has been pretty damn consistent. Only the last 5 runs here, but even if you ran a loop of the last 10 runs, it holds.

NBAcentel
Member
Might get a lightning shot vs snow lol 
That warming in sfc temps near initialization is propagating forward in the runs.
Rip
Looks like my thoughts about a big nothing burger are going to be realized.
Every run of the HRRR and most other models have a complete crash of the Column at 2 am for Raleigh ... that has always been my benchmark to look at .. if we get a changeover at 2 we can probably expect around 3 .. any earlier is just gravy ... any later is praying on 4 in/hr rates when the changeover occurs ?
This will encourage eveyone. At 5pm it was pc and 49 beech mtn pkwy. Its snowing and ground asphalt ,everything covered up cause of rates right now. So same wx conditions all day as many expierenced and the rain flipped and rates trumped full day solar insulation on asphalt,ground immeaditely.

 www.resortcams.com
Beech Mountain Parkway WebCam - Resort Cams
This High Country NC webcam is located near Beech Mountain Town Hall is a great resource to check out road and weather conditions during the winter months.
www.resortcams.com
SouthGarnerSleet
Member
HRRR has been pretty consistent with the Rocky Mount area winning this thing. Going back to the 12z runs across the board... Rocky Mount, Wiltson, that area to the NE of Raleigh has been the sweet cakes with consistency.

Attachments
Looks like my thoughts about a big nothing burger are going to be realized.
I tried to tell everyone to temper their enthusiasm even though the models showed high totals. My point about surface temps, soil temps, warm nose, time to changeover to snow, and puddles of water knocking down possible totals was scoffed at by most. Everyone here should have been taking this into account so they wouldn’t be heartbroken. Sorry to say that, but y’all know we ALWAYS find a way to mess these things up.
Precip beginning to really blossom .. these rates are going to be epic I cannot wait ... and that lightning strike in the mountains already? Thunder snow has to be a possibility ... also any chance we can get one of those shiny HRRR maps for the meat of the show
It’s 3am .. you’re in Raleigh NC ... snow coming down so hard you got .4 miles of visibility and wind gusts up to 20 knots .. what a time that will be
SWVAwxfan
Member
Rain already overspending the NRV.
Dewpoint Dan
Member
too bad most people will be asleep and will miss itIt’s 3am .. you’re in Raleigh NC ... snow coming down so hard you got .4 miles of visibility and wind gusts up to 20 knots .. what a time that will beView attachment 68613
EastNcHeel
Member
Congratulations???I tried to tell everyone to temper their enthusiasm even though the models showed high totals. My point about surface temps, soil temps, warm nose, time to changeover to snow, and puddles of water knocking down possible totals was scoffed at by most. Everyone here should have been taking this into account so they wouldn’t be heartbroken. Sorry to say that, but y’all know we ALWAYS find a way to mess these things up.

Cary_Snow95
Member
41 degrees in Cary. Still clear skies
norcarolinian
Member
48° and rain just started
52 here in South Charlotte.Mild rain incoming

What's up with the haters/troll comments going on in this thread? Stop, please.
I tried to tell everyone to temper their enthusiasm even though the models showed high totals. My point about surface temps, soil temps, warm nose, time to changeover to snow, and puddles of water knocking down possible totals was scoffed at by most. Everyone here should have been taking this into account so they wouldn’t be heartbroken. Sorry to say that, but y’all know we ALWAYS find a way to mess these things up.
I mean, you're absolutely right. As much as it sucks, I think we all realize this was never our storm. (For the Carolina's). It sucks. As we have missed so many good opportunities these last few weeks. I still think most of us see a solid event before winter is over. But this isn't it. Although NE NC may actually do okay tonight. Can surprises happen? Absolutely! But as @Myfrotho704_ alluded to I think some thunder is more likely than snow for a lot of us. And if someone does get lucky tonight and see thundersnow with no visibility - take some photos. That sounds epic!
I put tinfoil on the patio, and had rocks tie it down. We’ll see if snow sticks to it faster.
LukeBarrette
im north of 90% of people on here so yeah
Meteorology Student
Member
2024 Supporter
2017-2023 Supporter
Wasn’t suppost to start yet right?Rain already overspending the NRV.
Cary_Snow95
Member
Interesting how central NC is a good 5-6 degrees cooler than the Piedmont
blueheronNC
Member
too bad most people will be asleep and will miss it
I’ve never missed a Jeb Walk here yet, but getting too old to ruin my sleep at 3am for this
Shadow of the Apps
Member
moderate to heavy completely melted snow has begun in the southern foothills. Good luck to everyone out east, hoping you guys cash in.
Shaggy
Member
too bad most people will be asleep and will miss it
Do you think any of us are sleeping tonight?
LukeBarrette
im north of 90% of people on here so yeah
Meteorology Student
Member
2024 Supporter
2017-2023 Supporter
Shaggy
Member
BIg drop in Dp just the last 3 hours. We had a DP of 45 at 5ish and it's now down to 37. Good sign
I mean, you're absolutely right. As much as it sucks, I think we all realize this was never our storm. (For the Carolina's). It sucks. As we have missed so many good opportunities these last few weeks. I still think most of us see a solid event before winter is over. But this isn't it. Although NE NC may actually do okay tonight. Can surprises happen? Absolutely! But as @Myfrotho704_ alluded to I think some thunder is more likely than snow for a lot of us. And if someone does get lucky tonight and see thundersnow with no visibility - take some photos. That sounds epic!
I mean, I’m in NE NC and I don’t think anything happens here. Might be pretty to look at falling (if it changes) but there isn’t going to be any accumulation due to what I posted above. Sorta used to it by now. LOL. I hope I’m wrong...
Do you think any of us are sleeping tonight?
I know I am.