Webberweather53
Meteorologist
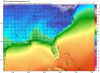
Here's the corresponding 6-10 day EPS mean.

If your going to worry about one model run showing rain. You’re going to have a long missable winter.20th system is now rain and a cutter! Pattern change, FTW!
If your going to worry about one model run showing rain. You’re going to have a long missable winter.
It’s half over, and I am!If your going to worry about one model run showing rain. You’re going to have a long missable winter.
Man, the best storms are always 14-16 days out! And this one would still be rain, verbatim!
Why?It’s half over, and I am!
All the greatness that is supposed to happen , is always 15 days away, and been that way for like 3 weeks! And the 1” of sleet in December, didn’t really make it a great winter, so farWhy?
It’s half over, and I am!
Guess you can’t please everyone. ????Why?
You know 1 inch of sleet is a whole lot more then what I got. But I haven’t given up. Your not a true weather weenie if you give up so easily. That was like a stretch of 5 years and we didn’t even see a snowflake around here. But, I still didn’t give up hope.All the greatness that is supposed to happen , is always 15 days away, and been that way for like 3 weeks! And the 1” of sleet in December, didn’t really make it a great winter, so far
I agree with the last part. But pattern change actually seems like it is in progress now, not as quickly as we would have hoped a few weeks ago, but within the general time frame that many non-JBs expected. It’s frustrating to have missed out on the December storm. Believe me. I know. But, there’s a reason to be optimistic. At least a little.All the greatness that is supposed to happen , is always 15 days away, and been that way for like 3 weeks! And the 1” of sleet in December, didn’t really make it a great winter, so far
It ain’t over til it’s over!All the greatness that is supposed to happen , is always 15 days away, and been that way for like 3 weeks! And the 1” of sleet in December, didn’t really make it a great winter, so far

Just last week folks where punting first 15 days of January at a minimum. Heck Robert was punting,Larry congratualting him on not being stuborn like JB. But its January 10th. Walk outside today if you havent been and let that breeze hit you for a few minutes. Got full sun here and well be lucky if we hit 40 today. Also webber has hit nail on the head,there is a strong signal for a big storm next weekend, 20th give or take a day. We may miss and MA get pummeled or we may luck out get nailed or western areas get a nice backside thump. All cards on table. But its everyones next shot after this weekends weak sauce exits stage right. Watch the ensembles, espeacilly eps and the low plots where it shows all 50+ members on one frame and their lp placements. Probablly see like 25+ on there 10 days out and then each cycle see if they consilidate to and grow in number to the same general location. Then 7 days out see if the global op models start picking up on it as well. Looking at 5h from 10 days away it sure looks like something big should be brewing and we should have some good atlantic blocking and nice ridge out west.

You know 1 inch of sleet is a whole lot more then what I got. But I haven’t given up. Your not a true weather weenie if you give up so easily. That was like a stretch of 5 years and we didn’t even see a snowflake around here. But, I still didn’t give up hope.
Telling we have a 1040h just n of upstate NY and we we will be raining. We usually lament not having a 1040h, we get one and it doesn’t matter. What’s not to like about 33F in mid January rain.
Maybe in mid Feb when our averages are 10F warmer it will be easier to get snow.
It's long range and yeah it can change, but the promised land keeps getting blurred out in time, something just keeps mucking it up. EPS 10 days still stinks. I'm probably just being impatient, but yeah. It looks to me like January is essentially shot IMO. We're probably in the game, but January looks like a hail mary....which is a shame considering the expectations this winter.Well that's just the track of the low. If it rode the coast we'd snow/sleet I think. Miller Boo boo will boo boo.
But I still don't get the warm fuzzies on the GEFS/GEPS long range. Now the trough is in the central US because the western ridge is too far west.

Yep, there is that potential area everyone was talking about. sheesh.. major ice.Glad to see no one saw the 12z GFS. It just dumped Tony’s sleet in my backyard.
Sent from my iPhone using Tapatalk
You mean this? Shhhhh..... I won't tell anyoneGlad to see no one saw the 12z GFS. It just dumped Tony’s sleet in my backyard.
Sent from my iPhone using Tapatalk

You mean this? Shhhhh..... I won't tell anyone


I'm sorry but this is compete bullcrap aside from the fact we're getting a nickel/dime storm in arguably the transition period to a cooler pattern, it's pretty obvious things are changing in the extended period with a North Pac high throwing the coldest air relative to normal into North America starting next week.
View attachment 10549


The GEFS has a -EPO bias inbthe extended but there will in fact be a -EPO next week and we’re fixing to move into the favored Niño window for cold and snow in the SE US (late Jan-early Mar) makes this forecast a bit more believable for nowDamn the gefs is brutal in the long range . As Webber said , the wait is over the change is happening

Sent from my iPhone using Tapatalk
I'm sorry but this is compete bullcrap aside from the fact we're getting a nickel/dime storm in arguably the transition period to a cooler pattern, it's pretty obvious things are changing in the extended period with a North Pac high throwing the coldest air relative to normal into North America starting next week.
View attachment 10549


I’ve already discussed briefly why I thought we’d get a -EPO next week and potentially beyond as tropical forcing enters the Indian Ocean and we enter a more favorable portion of the AAM/MT cycle plus the strat warm event and getting into favorable niño climo as we approacj February. There were legitimate reasons not to get too sucked into the ridiculously cold forecasts from the models in the extended range a while back because the pattern just wasn’t that favorable. I’m well aware of the biases in the previous period but a large component of the bias is state dependent and it’s apples-oranges because the pattern is much different and this is exactly what Ive been touting would indeed happen later in JanuaryWebb,
What do you make about the reason for unusually strong cold bias not just from GEFS but also from EPS (although EPS cold bias not as bad as GEFS)? Also, do you hesitate to believe the intensity of cold because of the cold bias or do you think the cold bias will finally abate now that W Pac convection is finally starting to weaken out in time on the EPS? Are the bias and W Pac convection connected?
Check this out from Radiant this morning about really bad 11-15 day model cold bias:
"Models Have Been Cold Biased In 11-15 Day
The cold biases of the past few weeks in the 6-10 Day period were examined in yesterday’s report. Here, we do the same analysis for the 11-15 Day period. The table on left highlights the average biases observed over the past 30 Days for select locales. Notably, most models have been cold biased. The only exception has been the often poorest and most volatile GFS OP model in parts of the Rockies and Plains. Both the GFS EN and Euro EN models have been cold biased in each location examined in this discussion, and the same can be said about our forecast. The GFS EN has been the most biased in this regard, being too cold on average by a large 10° in Minneapolis and by more than 8° in St. Louis, Chicago, Cincinnati, Washington DC and Atlanta. The maps on left are from this morning’s 0z model runs and what they would look like with consideration to the past 30 Days of verification. The bias corrected Euro notably holds onto a warmer pattern."
-----------------------------
And from Radiant yesterday about the 6-10 day model cold bias:
Models Cold Biased In Recent Weeks
Models have carried a significant cold bias over recent weeks, and the table within this discussion highlights the average bias of the past 30 Days for select locales in the 6-10 Day period. The GFS EN has been particularly poor in its Midwest projections, averaging too cold by 7.6° in Minneapolis, 6.1° in St. Louis and 6.3° in Chicago. The Euro EN has also been too cold, off by 4.2° in Minneapolis, 2.9° in St. Louis and 3.0° in Chicago. Larger cold biases are seen among all models from the Southeast through the Mid-Atlantic as well.
Here comes our next threat. Been consistent on models. Also this should make the midlands happy.
View attachment 10558View attachment 10559View attachment 10560
Looks like we have to sacrifice this one... but like you said. ... door is fixing to open big time for us ...The 20th-22nd period has been showing up with strong signals for a few days, too. I'm not too disappointed on this weekend's storm being mostly a dud here, because it is just opening the door for the pattern change and for better storm chances to come.
What is it showing?Euro day 10 looking interesting