What was the pna?
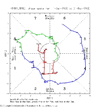
The PNA on 1/7/1988 was a moderate + at +0.689.
ftp://ftp.cpc.ncep.noaa.gov/cwlinks/norm.daily.pna.index.b500101.current.ascii
What was the pna?
The greatest storm ever for most of the NGA, Carolinas, Jan 88, had a +NAO! NAO is overrated, PNA+, single most important stat! Would like to know the MJO was during 88 storm

Yeah, that the ticket...... positive PNA coupled wit a phase 8 inside the circle. No wonder we had a major winter storm.
Yeah, that the ticket...... positive PNA coupled wit a phase 8 inside the circle. No wonder we had a major winter storm.
Why?I like this… View attachment 112930
If we’re going to have another late bloomer, having some WAR pushing in might slow it down. AgreedI like this… View attachment 112930
In all fairness, I think Larry started doubting his call on that -3 several days ago. I'm not quite ready to call winter over yet and don't give a damn what the models are showing. We are heading into prime time as far as I am concerned. No way I am rushing it along based on some numerical output, which have been horrible so far. What was it? Two whole days ago that all the models were showing a blockbuster mid month? Pfffffffft......@GaWx I think your -3 for first half of feb is In jeopardy. +4 up to today and this coming week looks mild
?In all fairness, I think Larry started doubting his call on that -3 several days ago. I'm not quite ready to call winter over yet and don't give a damn what the models are showing. We are heading into prime time as far as I am concerned. No way I am rushing it along based on some numerical output, which have been horrible so far. What was it? Two whole days ago that all the models were showing a blockbuster mid month? Pfffffffft......
Ok…In all fairness, I think Larry started doubting his call on that -3 several days ago. I'm not quite ready to call winter over yet and don't give a damn what the models are showing. We are heading into prime time as far as I am concerned. No way I am rushing it along based on some numerical output, which have been horrible so far. What was it? Two whole days ago that all the models were showing a blockbuster mid month? Pfffffffft......
Looks a bit better than 12ZI see potential with this look.
View attachment 112931
@GaWx I think your -3 for first half of feb is In jeopardy. +4 up to today and this coming week looks mild
Outside activities requiring warmth are easy to do from April through October. I don’t understand how so many look forward to tracking chances and then after 5 weeks of cool weather are like okay bring on 6 months of heat and humidity.Whatever it takes…Ready to put my pool in and do some gardening…
Maybe two for anything substantial over an inch or two. From mid month on is the time I'm watching looking for signals anyway.Still looking for more snow in the mountains.. Will have to be patient and wait about a week....
Outside activities requiring warmth are easy to do from April through October. I don’t understand how so many look forward to tracking chances and then after 5 weeks of cool weather are like okay bring on 6 months of heat and humidity.
This is great I wonder what the real data says about +PNAs past couple decades. Thanks for the research!
