tennessee storm
Member
Just always seems be at the end …only get pushed further n further
Just always seems be at the end …only get pushed further n further
It is quite the pattern squeeze play though.
-NAO / MJO Phase 7
vs.
-PNA / -EPO
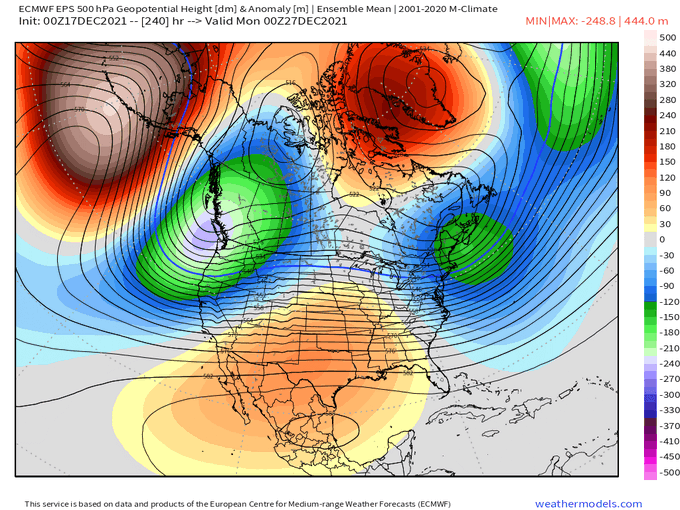
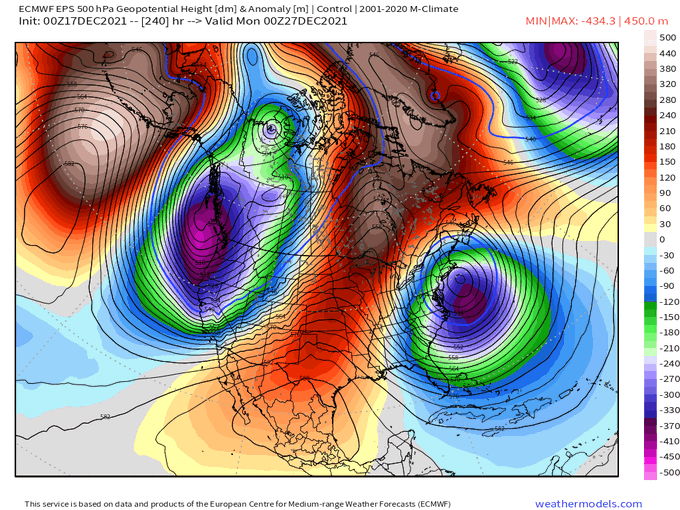
I'm sure you can go look for yourselfHow were the EURO/EPS at 00z? Didn’t see many posts about it
I just assumed it was colder considering he didn’t post it ??I'm sure you can go look for yourself
From what I could see the EPS wasn’t bad for cold at least for the Carolinas at the end of the runI'm sure you can go look for yourself
How were the EURO/EPS at 00z? Didn’t see many posts about it
The GOM temps have nothing to do with our thermals or storm track if the upper flow is oriented correctly. We simply need a cold air source and a pattern that doesn't feature a bubble ridge in the center of the country.I bet the unusually warm gulf of Mexico (for this time of year) is not helping our storm track and thermals so far this winter. Also led to the deadly tornadoes west of us I saw from multiple sources.


I’ve been hearing that the ECMWF BC has been to slow with the MJO waveI'm still a believer that we will need the MJO to push into phase 8 to change things up. It's unclear if it will make it there.


This is great info! My area in the mid-south had significant snowfall during four out of five of those periods and unusually long periods with snowcover on a couple as well. Glad to know there is at least some hope without much help from the Pacific.These 5 periods are the only two week plus long cold periods at ATL since 1950 that were during a -PNA:
- 12/29/1967-1/13/1968: 0.2” + 2 Ts of SN
- 12/1/1968-1/16/1969: 3 Ts of SN
- 12/27/1978-1/9/1979: 2 Ts of SN
- 1/24/1979- 2/21/1979: major ZR & 4.4” of sleet from different storms
- 11/27/2010-12/25/2010: 1.3” Christmas snow (only measurable one on record?) plus 3 other trace to 0.1” wintry events.
So, what did these rare five periods have in common to be able to get that longlasting cold during a -PNA? A -AO and a -NAO were both present every time with them being quite strong during most of these 5 periods. A -EPO was present only during 3 of the 5 periods….so, not crucial. ENSO wasn’t crucial. The key is the strong -AO and -NAO. Furthermore, note the multiple wintry precip events during all 5 periods.
Only to fold as it gets closer to date night.Find someone who loves you like these models love the SER.
Sent from my iPhone using Tapatalk
I think we collectively put too much weight on the MJO. It's just not that simple, IMO. Don't get me wrong, I'd like to see it move into the colder phases too. But there are plenty of other things that can screw things up.I'm still a believer that we will need the MJO to push into phase 8 to change things up. It's unclear if it will make it there.


I personally don’t get this talk. I understand with a -NAO it backs down but we haven’t seen that this season yet . We are having a very warm December . Sure doesn’t seem like the SER has folded . Greenville sc broke their all time December high. Show me where it’s folded outside of model land .Only to fold as it gets closer to date night.
I’m not upset about the MJO, I would be satisfied with it stalling in phase 7, as it is a colder phase for January.I think we collectively put too much weight on the MJO. It's just not that simple, IMO. Don't get me wrong, I'd like to see it move into the colder phases too. But there are plenty of other things that can screw things up.
We need to just prepare for variability, with a warm bias, this winter. But ill bet the stars align a couple/few times for us to track some winter weather.
It’ll probably loop back to 6 then.I’m not upset about the MJO, I would be satisfied with it stalling in phase 7, as it is a colder phase for January.
I'm with you. But something needs to change somewhere to reconfigure the N Pac.I think we collectively put too much weight on the MJO. It's just not that simple, IMO. Don't get me wrong, I'd like to see it move into the colder phases too. But there are plenty of other things that can screw things up.
We need to just prepare for variability, with a warm bias, this winter. But ill bet the stars align a couple/few times for us to track some winter weather.


I'm still a believer that we will need the MJO to push into phase 8 to change things up. It's unclear if it will make it there.


Phase 7 is not great in December, phase 7 is good in January, 7 will become favorable in janAgreed. The pattern is not changing for a reason. Definition of insanity, doing the same thing and expecting a different result. 7 is likely not going to do it IMO.
7,8,1 or in the circle of death is good. 6,5,4,3 sucks balls.Okay I’m so confused. Is phase 7 good for snow in January or not? Half the people are saying yes and half are saying no. Is there any maps showing what a phase 7 does in January?
But 1 is crappy because it’s the least snowiest phase. The good ones are 7,8,2.7,8,1 or in the circle of death is good. 6,5,4,3 sucks balls.
