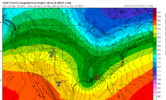
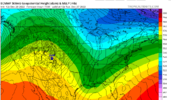
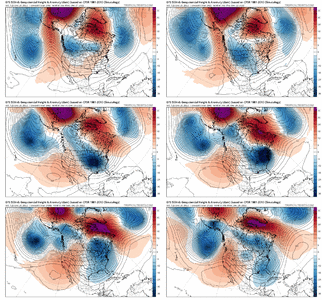
Oh for sure. It's almost too far west already lolI'll take it at D7 I really fear we end up similar to the cmc here. Seasonal trend has been too far E with the western ridge only to have to adjust W in time
-
Hello, please take a minute to check out our awesome content, contributed by the wonderful members of our community. We hope you'll add your own thoughts and opinions by making a free account!
You are using an out of date browser. It may not display this or other websites correctly.
You should upgrade or use an alternative browser.
You should upgrade or use an alternative browser.
Wintry December 23-26 2022 Winter Weather and Cold
- Thread starter SD
- Start date
Note all of the 12z guidance has ticked north with the Thursday-Friday vortex.
While if that continues, the cold will be a little less extreme, and the hope for some backside flurries wane, a glass half full look is perhaps that helps with the post Christmas period.
While if that continues, the cold will be a little less extreme, and the hope for some backside flurries wane, a glass half full look is perhaps that helps with the post Christmas period.
rburrel2
Member
The big low up top and shortwave crashing into the NW both slowing is huge.
Ron Burgundy
Member
Sledding on Tuesday. Golf on Thursday.It's always a week away...???

Probably gonna end up even west of me.Oh for sure. It's almost too far west already lol
Stormlover
Member
Trouble by Christmas night or monday?


SnowwxAtl
Member
This must be the clipper!Trouble by Christmas night or monday?
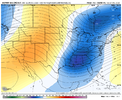
Honestly with the past storm and the CMC and now the Euro favoring amplification. I think it’s safe to put the GFS in third here.This is what GFS does with it..color me skeptical View attachment 127860
Stormsfury
Member
This is what GFS does with it..color me skeptical View attachment 127860
Looks like it splits and uses the trailing wave to act as a kicker instead. Not sure if I buy that vs the other guidance
NBAcentel
Member
ChattaVOL
Member
- Joined
- Jan 23, 2021
- Messages
- 4,545
- Reaction score
- 15,016
- Location
- Lebanon Township, Durham County NC
GFS has my backyard dropping fifteen degrees from 12z-13z on Friday. It’ll be in the teens before the sun goes down.
All of this without snow or anything else falling. Pretty exceptional.
All of this without snow or anything else falling. Pretty exceptional.
Webberweather53
Meteorologist
?
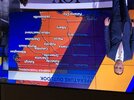
My Friday Saturday Sunday noon temperatures are going to be 25, 25, 31 ?
Webberweather53
Meteorologist
There wasn't a ton of eye-catching members on that suite, but the pattern is what you want to see. Ridge over the Intermountain West & trough axis near the TN Valley
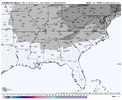
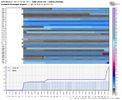
Looks like the GRAF, which is a trash model. ?View attachment 127870
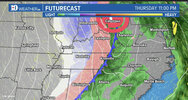
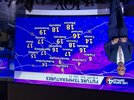
Haven't been paying much attention, but randomly saw this and it grabbed my attention... WBIR out of Knoxville.
Brent
Member
it’s late sister, the RPM model nailed the January 2018 storm thoughLooks like the GRAF, which is a trash model. ?
SnowNiner
Member
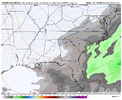
Snow or no snow, it really is an epic setup pattern wise. One we don’t see often if ever. Everything going for us except snow. I type this as it’s ripping sleet here at the moment. Go figure View attachment 127871
Only thing I would have liked to finish it is an active southern jet, (and it lasting another couple weeks, lol). Everything has been northern stream dominate, and the timing is just all wrong right now it seems. This storm were tracking now looks way late and east. Maybe we get the western trend and amp it up even more last minute, but not sure it can back that far up.
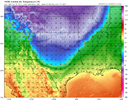
Basically what the ICON has been showingGood grief... 0 degrees here at the end of the HRRR this is the middle of the day Thursday! ?View attachment 127876
olhausen
Member
Stormlover
Member
Flash freeze and snow squalls for far north Ala.


SnowwxAtl
Member
I really hope this overproduce in terms of snow!
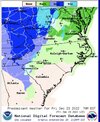
Genuinely surprised they included ATL in the second graphic. I just got off work and got a notification about the Wind Chill Watch they issued for Thu night into Christmas Eve. Wind chills across N. GA ranging from -10 to -20 below zero. That’s gonna be brutal.
SimeonNC
Member
I knew from the start that snow squalls would be a factor for a few days, glad to see the NWS vindicate me lolFlash freeze and snow squalls for far north Ala.
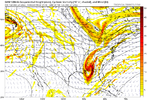
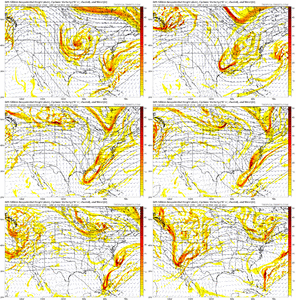
The wave dropping down after the Arctic blast has a decent look to it now on the modeling, but an issue I see is this…what we’d like to see as the wave drops down is a jet streak behind it to drive energy and lift into the base of the trough in the left exit region of the jet streak (a key feature in the Jan 2003 setup for example). With this one, the jet streak is weakening, and thus, the dynamics aren’t there for it to really explode like it needs to in the base of the trough. On the loop, it looks like the increasing jet flow from the west is breaking down our digging trough via an anti-cyclonic wave break (the top part of the ridge behind it is toppling over and the whole jet dynamics are weakening). I will continue to watch of course, but I suspect this isn’t something that is going to suddenly improve on the modeling. Of course, now that I state this, the happy hour GFS will assuredly go bonkers with it and look good
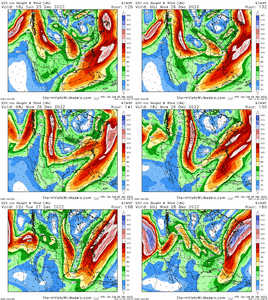

Last edited:
Yes, I look everywhere for nuggets of encouragement. I see Japan likes the super-clipper idea too.


GeorgiaGirl
Member
Man, this is something else...


I wonder when the last time was that New Orleans was below freezing in the middle of the afternoonMan, this is something else...

I wonder when the last time was that New Orleans was below freezing in the middle of the afternoon
Guessing that freak upper level low snowstorm back in 2008 maybe?

