NWS RAH calling for 5" of snow for Raleigh. Seems too aggressive to me.
-
Hello, please take a minute to check out our awesome content, contributed by the wonderful members of our community. We hope you'll add your own thoughts and opinions by making a free account!
You are using an out of date browser. It may not display this or other websites correctly.
You should upgrade or use an alternative browser.
You should upgrade or use an alternative browser.
Wintry Dec 8-10th Winter Storm
- Thread starter SimeonNC
- Start date
RollTide18
Member
Oklahoma Mets are taking a beating on Social Media today
No snow for you
Member
- Joined
- Dec 28, 2016
- Messages
- 583
- Reaction score
- 890
What time does the GFS FV3 run?
Kylo
Member
18z runs in general had a stronger ull which flipped RDU sooner. But good news is most models are showing front end snow. See if 0z continues with stronger ull.
Kylo
Member
It’s here on nceps eval site under GFSWhat time does the GFS FV3 run?
http://mageval.ncep.noaa.gov/model-guidance-model-area.php
Lets just hope the same doesnt happen to NC mets in a couple days. Hopefully NC will not suffer the same disaster OK did.Oklahoma Mets are taking a beating on Social Media today
Avalanche
Member
That's because it is.NWS RAH calling for 5" of snow for Raleigh. Seems too aggressive to me.
Webberweather53
Meteorologist
NWS has 5-11" for Charlotte. I take it some of you think that's too high ? I see Webber has 1-3 for Charlotte LOL. What does Webber see that the NWS doesn't ?
A 50-60+ KT jet at 700 hPa coupled to large amounts of QPF often leads to the warm nose being stronger than forecast and the heavier precipitation rates can lead to the creation of an in-situ dome (superimposed onto the larger-scale CAD) that accelerates the end of the warm nose aloft in the downwind direction as considerable latent/sensible heating is deposited onto where the warm nose is strongest while cooling occurs below the level of maximum heating aloft. Another obvious caveat with the models is they don't have sufficient vertical resolution, the proper mixing schemes, and pretty crappy convective parameterization schemes to account for all of the above, thus leading to weaker warm noses than forecast (& often the low-level cold dome is weaker than reality in these same models).
This profile on the NAM while taken at face value (bad idea) is all snow near RDU, that's an absurd amount of mid-level veering and warm air advection above the CAD dome. Apart from all of the above, I've been burned many times the last several years figuring the models would have a good handle on this feature, and figured the warm nose wouldn't be that strong, it's usually a good idea to go a few degrees warmer near the height of the warm nose in situations like this and that favors less snow and more mixed phase precipitation in areas like Charlotte and Raleigh, this could end up being a respectable ice storm for someone in/around these areas.
The NWS GSP snow forecast of 5-11" here is likely way out to lunch (shocker) and assumes more of the precipitation will fall of snow here, the main precipitation type is liable to be sleet.

Brent
Member
Be thankful we don’t live in Oklahoma . The winter storm bust there is amazing today
Sent from my iPhone using Tapatalk
Lol its been something else to see
At least we never had a shot
Snowflowxxl
Member
The NAM had Oklahoma near 2 feet the other day lol
That's why you never take models seriously beyond 48 hours.The NAM had Oklahoma near 2 feet the other day lol
Avalanche
Member
I hope some magic gets worked into this sytem when it arrives to our south.
NoSnowATL
Member
+1000That's why you never take models seriously beyond 48 hours.
Snowflowxxl
Member
FV3 doesnt look as good from what I see
DadOfJax
Member
We are less than 24 hours away..this place should be cranking!
Whoever said American was dead was wrong. It's been more active over there than on this site !
Just today.Whoever said American was dead was wrong. It's been more active over there than on this site !
Arjen Robben
Member
Does this also apply to upcoming storm ?That's why you never take models seriously beyond 48 hours.
It applies to every storm ! I don't trust any model until it's at 48 hours or less. So basically anything past 6pm on Sunday is highly suspect.Does this also apply to upcoming storm ?
B
Brick Tamland
Guest
I think it sounds about right.NWS RAH calling for 5" of snow for Raleigh. Seems too aggressive to me.
No snow for you
Member
- Joined
- Dec 28, 2016
- Messages
- 583
- Reaction score
- 890
FV3 holding serve it looks like to me
Nomanslandva
Member
Did anyone post the 12zEPS?
NoSnowATL
Member
More NC posters probably.Just today.
Jessy89
Member
Fv3 still looks like snow north of 85 to me. In South Carolina if it verifies fv3 will be the go to model. I think nam slows it down way to much
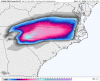
So here is an interesting model to pay attention to. New in 2016, was a response for the US to get better numerical modeling after our failure with Sandy in 2011. Just had major upgrades to version 3.0. It's the NBM (National Blend of Models)...very similar to the NWS superblend. It contains input from pretty much everything (ECMWF, GFS, Canadian, NAM12/3k, some WRFs, HRRR, etc). It has a ton of interesting parameters (Unfortunately I haven't been able to create plots for all of them yet), like variable ratio snow accumulation, positive energy of warm nose, negative energy of cold surface layer, line and flat ice accumulation and more. This model cycles every hour, so there are frequent updates. Here is the simulated reflectivity with p-type. While plots here only go to 36 hours, it runs out to 240 hours, although not all parameters are available after a certain number of hours. I'm interested to see how this pans out, it's basically a massive ensemble mean, so probably pretty well.
https://media.giphy.com/media/1zR7XLSCwPbnt3XVrx/giphy.gif
https://media.giphy.com/media/1zR7XLSCwPbnt3XVrx/giphy.gif
D-Ray
Member
i think this might be one of the best runs of the FV3 in my area of the upstate but they all seem to have been good here !!!
So here is an interesting model to pay attention to. New in 2016, was a response for the US to get better numerical modeling after our failure with Sandy in 2011. Just had major upgrades to version 3.0. It's the NBM (National Blend of Models)...very similar to the NWS superblend. It contains input from pretty much everything (ECMWF, GFS, Canadian, NAM12/3k, some WRFs, HRRR, etc). It has a ton of interesting parameters (Unfortunately I haven't been able to create plots for all of them yet), like variable ratio snow accumulation, positive energy of warm nose, negative energy of cold surface layer, line and flat ice accumulation and more. This model cycles every hour, so there are frequent updates. Here is the simulated reflectivity with p-type. While plots here only go to 36 hours, it runs out to 240 hours, although not all parameters are available after a certain number of hours. I'm interested to see how this pans out, it's basically a massive ensemble mean, so probably pretty well.
https://media.giphy.com/media/1zR7XLSCwPbnt3XVrx/giphy.gif
Here's a still image in case you can't get the giphy link to load
.png")
A lot of the active posters on that board live in the Western Piedmont and mountains of NC. Makes sense that things would be hopping over there.Whoever said American was dead was wrong. It's been more active over there than on this site !
Snowflowxxl
Member
FV3 is pretty much the same, its been consistent all week. The backside is pretty much a no go. Every model seems to have trended warm with it today.
No snow for you
Member
- Joined
- Dec 28, 2016
- Messages
- 583
- Reaction score
- 890
Yep. Not sure why no one is talking about iti think this might be one of the best runs of the FV3 in my area of the upstate but they all seem to have been good here !!!
Snowflowxxl
Member
Place has been pretty dead the past two days. I have no idea why.
GeorgiaGirl
Member
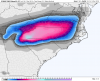
Just gonna drop this bad boy off here since pivotal isn't finished (although it is truly insane in the snow areas):

The FV3 is either the new DGEX or the kang.
The FV3 is either the new DGEX or the kang.
Mean and ControlDid anyone post the 12zEPS?
Attachments
Jessy89
Member
Look.. if the gfs was any good they wouldn’t replace it with fv3. So considering it’s updated technology. It might be rightJust gonna drop this bad boy off here since pivotal isn't finished (although it is truly insane in the snow areas):
The FV3 is either the new DGEX or the kang.
FV3 finally in the process of caving. Can’t wait to see its Kucharacha map.
So the past few days I have been thinking of heading up for a snowy day hike northeast of Cashiers, near Lake Toxaway, tomorrow... (I don't have Sunday available). This dry air modeled by the NAM concerns me a bit. Is there any past history on this? It's only a 7-hour difference, but for me, the difference between snow starting on a hike at 5 PM versus snow starting on a hike at 10 AM would be humongous. It seems like most modeling supports a start around 10 AM (except the 12km NAM), and GSP is similar, having changed the start time of their WSW to noon. How long does dry air take to erode usually in situations like this?
Anyone?
No snow for you
Member
- Joined
- Dec 28, 2016
- Messages
- 583
- Reaction score
- 890
Stop. It will never cave. It is strong like that warm nose above.FV3 finally in the process of caving. Can’t wait to see its Kucharacha map.
Jessy89
Member
Why you say thatFV3 finally in the process of caving. Can’t wait to see its Kucharacha map.
wake4est
Member
- Joined
- Jan 3, 2017
- Messages
- 52
- Reaction score
- 138
FV3 finally in the process of caving. Can’t wait to see its Kucharacha map.
The kuchara has 8” in wake thru 45.
Because only a relatively small portion of the board is impacted by this event. So you have cliff diving and disinterest.Place has been pretty dead the past two days. I have no idea why.