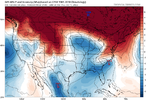
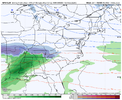
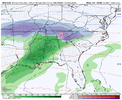
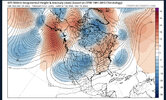
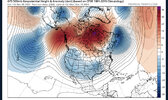
Sometimes it can be a cold pattern and not snow, sometimes it can snow in a warm pattern, Sometimes model runs don't show snow for their run but it snows in that 10-16 day time frame, Sometimes models show a foot of snow at 36 hours and it rains.Where’s all the good weenie runs we were expecting with this great patten?
-
Hello, please take a minute to check out our awesome content, contributed by the wonderful members of our community. We hope you'll add your own thoughts and opinions by making a free account!
You are using an out of date browser. It may not display this or other websites correctly.
You should upgrade or use an alternative browser.
You should upgrade or use an alternative browser.
Pattern Dazzling December
- Thread starter Rain Cold
- Start date
Canadian plasters upslope with a foot of snow on backside , GFS Nada.
Ukmet and Canadian ops are just above freezing, HP placement is diff so far compared to gfs.
Ukmet and Canadian ops are just above freezing, HP placement is diff so far compared to gfs.
Webberweather53
Meteorologist
^^Yep, RDU shows near a half inch of freezing rain, but that occurs with temps of 31/32 degrees. So the accretion would be very limited. Maybe (right now) something to look for in the NW Piedmont/Foothills. Need that CAD to build in stronger with some cold/dry air in the upcoming model runs.
NBAcentel
Member
GEFS was much colder surprisingly
Now what I could see is us seeing some backside snow showers or just flurries as this is looking more and more Miller B ish .. that could be the saving Grace .. I would love to just see flakes fall in December!
I’m away from my computer and can’t look at the individual members. Does appear to have strong support for a colder solution or is just a couple members skewing things?GEFS was much colder surprisingly
Webberweather53
Meteorologist
Gimme


AJ1013
Member
Snow down to the valley floor in Downtown Tucson is looking more and more likely with every run. GFS and Euro have me picking up about an inch ?. Mountains going to get buried. 2ft+ possible in Summerhaven and the ski resort 1hr from Tucson!
IT’S HAPPENING!
IT’S HAPPENING!
Hypsometric
Member
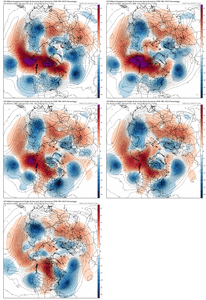
More and more of another piece of tpv diving south (which is what is disrupting the ridging west of Greenland). Does this trend continue? Can it actually interact with the storm system next week?
View attachment 125248
Hah, yeah we aren't done with this story yet.
I could see that. Lots of energy flying around on the backside as the colder airmass comes in. We’ve certainly seen that some over the years. I’m with you about having a hard time seeing much outside of the foothills and nw Piedmont though… just not enough snow cover to the north yet. Now a few days later, that might be a different storyNow what I could see is us seeing some backside snow showers or just flurries as this is looking more and more Miller B ish .. that could be the saving Grace .. I would love to just see flakes fall in December!
I'm seeing weaker trend over eastern seaboard unless I'm missing something here.
Hypsometric
Member
The wave is getting sheared in multiple directions. But we are in the middle of a HUGE model shift. There's a vortex diving like mad out of Canada and it's one/two more runs away from phasing in with our next week storm (if the trend continues), which could set off a bomb near Newfoundland and really set the stage for a suppressed follow up wave.I'm seeing weaker trend over eastern seaboard unless I'm missing something here.
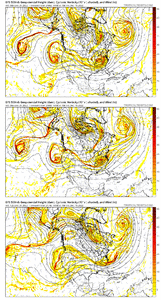
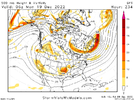
It’s already there at hr234 on the GFS ?The wave is getting sheared in multiple directions. But we in the middle of a HUGE model shift. There's a vortex diving like mad out of Canada and it's one/two more runs away from phasing in with our next week storm (if the trend continues), which could set off a bomb near Newfoundland and really set the stage for a suppressed follow up wave.
View attachment 125259
Last edited:
The next wave is in okie/north Texas I seeIt’s already there at hr234 on the GFS ?View attachment 125260
Blue_Ridge_Escarpment
Member
L
Logan Is An Idiot 02
Guest
We really need that first system to put nice snowpack to the north. That’s crucial imo
Sent from my iPhone using Tapatalk
Sent from my iPhone using Tapatalk
Sheesh we’re right on the edge of the most marginal cold you could ask for .. I hope suppression wins here like with the earlier system.Round 2 incoming…
View attachment 125263
Agreed… that why I’ve been calling it the table setter storm. Gets the snow pack put down in the northeast and sets up confluenceWe really need that first system to put nice snowpack to the north. That’s crucial imo
Sent from my iPhone using Tapatalk
Even though we may not like it, we should absolutely pull for the Northeast & Mid Atlantic to get slammed next week. It only helps us out as we continue to get deep into this pattern leading up to Christmas and beyond.
LukeBarrette
im north of 90% of people on here so yeah
Meteorology Student
Member
2024 Supporter
2017-2023 Supporter

Pants are gone
For some people here
I’ve said it a couple times in the last week or so, but this is the time frame to watch between the 18-22nd. All the teleconnections look favorable and I believe there will be a sufficient snow pack in place to the north. Don’t get caught up in specifics like this one look yet…a lot of folks could be in play at this time
Pants are gone
For some people here
iGRXY
Member
This first wave is interesting but I think you want it to set the stage for the 2nd potential around the 20th. That's where I think we have a legit at something. As others alluded, that large chunk of TPV diving southeast is about 1 run away from a phase in the 50/50 area and bombing off. That is a huge deal. Tons of confluence and CAD potential. That's extremely interesting to see where this goes and the GEFS signaling that stout of a CAD is also interesting.
Exactly. Looks like a wedge is at play here in NC. Either building, stubborn, or retreating.I’ve said it a couple times in the last week or so, but this is the time frame to watch between the 18-22nd. All the teleconnections look favorable and I believe there will be a sufficient snow pack in place to the north. Don’t get caught up in specifics like this one look yet…a lot of folks could be in play at this time
LukeBarrette
im north of 90% of people on here so yeah
Meteorology Student
Member
2024 Supporter
2017-2023 Supporter
Hmmm
Webberweather53
Meteorologist
The 12z GFS pattern is pure weenie fuel.


L
Logan Is An Idiot 02
Guest
Merry Christmas

Sent from my iPhone using Tapatalk

Sent from my iPhone using Tapatalk
Hypsometric
Member
Yep right now everyone should ignore surface features for the second wave. We are trying to get the Atlantic set for a suppressed second wave with good confluence over New England. If you can check those two items and have energy approaching with that in place, the odds are high for widespread wintry weather across the south. And we are so far out, the energy coming in the next wave will likely dramatically change as well anyways from how it’s modeled now.I’ve said it a couple times in the last week or so, but this is the time frame to watch between the 18-22nd. All the teleconnections look favorable and I believe there will be a sufficient snow pack in place to the north. Don’t get caught up in specifics like this one look yet…a lot of folks could be in play at this time
I gotta say, I’ve never really payed a lot of attention to the CFS but it’s been fairly consistent on this pattern change and has been fairly good on the timing of it for the last several weeksMerry Christmas
Sent from my iPhone using Tapatalk
L
Logan Is An Idiot 02
Guest
I gotta say, I’ve never really payed a lot of attention to the CFS but it’s been fairly consistent on this pattern change and has been fairly good on the timing of it for the last several weeks
I agree. It’s most likely overdone but still nice to see
Sent from my iPhone using Tapatalk
Blue_Ridge_Escarpment
Member
Euro coming in a bit colder through hour 75, we’ll see.
Definitely overdone, but really good on the overall pattern evolution.I agree. It’s most likely overdone but still nice to see
Sent from my iPhone using Tapatalk
More and more of another piece of tpv diving south (which is what is disrupting the ridging west of Greenland). Does this trend continue? Can it actually interact with the storm system next week?
View attachment 125248
This is a great observation from Hypso on the trend loop. In a split flow regime, the most important piece (IMO) is the strong low / trough over / off New England as this is the feature, when properly located, acts to keep waves tracking into the S Plains from climbing north as Hypso mentioned. I've never been a big fan of the term 50/50 low because that term is very NE Blizzard - centric (low at 50N / 50W off Newfoundland). For us in the south, we typically want to see that low farther to the S/SW, but there are all kinds of configurations that low can take on. Also, a lot of times, there are shortwaves that track thru the Great Lakes and feed into this low that end up being critical for the maintenance of the low and associated timing with the approaching southern stream wave.
Last point - a big west-based -NAO block helps with the formation of these big lows underneath the block, but it's not the only way to get the job done as the other main way is to have a big ridge go up in W Canada as shown in Hypso's trend loop
packfan98
Moderator
End of the GFS looks great! Merry Christmas!


