Dewpoint Dan
Member
I'm pretty sure you avg just as much snowfall as Fort Stockton does, despite them being 3,000'. You are further north. The further north you are, the less elevation you need.Yeah well it snows south of me a lot lol
I'm pretty sure you avg just as much snowfall as Fort Stockton does, despite them being 3,000'. You are further north. The further north you are, the less elevation you need.Yeah well it snows south of me a lot lol
I'm pretty sure you avg just as much snowfall as Fort Stockton does, despite them being 3,000'. You are further north. The further north you are, the less elevation you need.

We do that every year. It’s normal.My fear is that people will buy into the hype and then be sorely disappointed when their yard ends up snowless. I remember in Jan-Feb 2015 all the hype and i didn't see a flake.
That Feb 15-21st ranks right up there with some of the best cold shots I can remember. High of 22 at RDU with full sun in the 2nd half of Feb, incredibly impressive. The cold front that puked mashed potatoes for about 30 minutes was epic.My fear is that people will buy into the hype and then be sorely disappointed when their yard ends up snowless. I remember in Jan-Feb 2015 all the hype and i didn't see a flake.
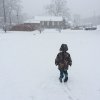
You need to move to the northern burbs. Here's what you missed.My fear is that people will buy into the hype and then be sorely disappointed when their yard ends up snowless. I remember in Jan-Feb 2015 all the hype and i didn't see a flake.
That was a solid one, lived back in Salisbury NC at the time and got between 5-6 inchesThat Feb 15-21st ranks right up there with some of the best cold shots I can remember. High of 22 at RDU with full sun in the 2nd half of Feb, incredibly impressive. The cold front that puked mashed potatoes for about 30 minutes was epic.
If the big system that month had been 100-200 miles south that Feb would be one we talked about for ages
Feb 15 is not a case for this.. there was hype and good follow through with hype, especially mid-south, northern Ala, northern Ga, parts of NC.My fear is that people will buy into the hype and then be sorely disappointed when their yard ends up snowless. I remember in Jan-Feb 2015 all the hype and i didn't see a flake.

Nah it's fine happy new yearAm i the only one who thinks its sort of silly to post 14 day model maps in the January thread ? Shouldn't that thread be reserved for serious conversation ? Seems like a 14 day model map belongs in banter.
We wouldn't have anything to talk about if we waited since everything disappearsAm i the only one who thinks its sort of silly to post 14 day model maps in the January thread ? Shouldn't that thread be reserved for serious conversation ? Seems like a 14 day model map belongs in banter.
Fixin to grill up $83 worth of (6) filet Mignon to go along with lobster. Etc.. Happy New Year!!
View attachment 61374

You need to move to the northern burbs. Here's what you missed.
I heard a loud band, and looked outside to see if the world was ending. Luckily we’re good!Why is there a giant health bar in the sky
Went for a super foggy nighttime beach walk and somebody had written creepy messages in the sand. “Leave now” and “you’re gone” and “I kill” so to say I was slightly unnerved is an understatement.I heard a loud band, and looked outside to see if the world was ending. Luckily we’re good!
Zero energy. ZeroAuburn and Georgia both coming out looking like %^#@ so far today
We are.Could we be looking at a Clemson/Bama Part V? That matchup would be a dog fight.
A few months unfortunately, but the raw data is available on nowdata of course ! This set of normals will be the most extensive set ever . There will be multiple kinds of normals that are calculated differently ( they did that a bit for 81-10 I can share those for y’all ) , normals for offshore locations in the mid Atlantic ( hopefully southeast as well) , interpolated normals for more places that don’t have stations and more ! Probably won’t be till the spring at earliest that we see any of it.Does anyone know when the updated climate normals (1991-2020) are typically released? Is it usually quickly after the new year, or does it take a few months?
Brick killed a guy.@Tarheel1 vs onset ice birdman vs not in mby brick vs southeast ridge stew point Stan . Who you got? I think stewpoint Stan comes out on top when he hits everybody with the it can’t snow in March or hit 70 in November card. Could be wrong tho , onset ice birdman might hit everyone with the mega BOOM BOOM WHEN THUNDER ROARDS GO INDOORS CAD. Underdog is brick.
I've spent time in that area. I have a good friend who lives in Milton !52 sunny degrees at Cape Henlopen State Park in Lewes, De. Here’s to a great 2021 for all
You have to compare the 1991-2020 raw to 1981-2010 raw . Your comparison is raw unadjusted 1991-2020 to adjusted 1981-2010. If we do that RDU actually didn’t warm even a fraction of a degree . However comparing raw 81-10 to raw 91-20 we find the annual mean increased by .7. Here is raw 81-10 vs raw 91-20 which once final normals are published in may , will be the difference between normals 81-10 vs normals 91-20. I made a 1991-2020 box using the raw 91-20 data but with the same changes made to 81-10 to make what I think will likely be close to the final product . Will post it laterBased on the NOWDATA, I have calculated the *unofficial* 1991-2020 normals for RDU airport. Interestingly, the 1981-2010 normals on the NOAA website were all 0.3-0.6°F higher than on the NOWDATA website, so it is possible these normals get revised a bit upward (perhaps due to a calibration issue?)
Average high temperature by month (change from official 1981-2010 climo based on NOAA website):
Average low temperature by month (change from official 1981-2010 climo based on NOAA website):
- January: 51.6°F (+0.7°F)
- February: 55.5°F (+0.3°F)
- March: 63.1°F (-0.3°F)
- April: 72.5°F (+0.1°F)
- May: 79.7°F (+0.1°F)
- June: 87.1°F (+0.1°F)
- July: 90.5°F (+0.3°F)
- August: 88.4°F (no change)
- September: 82.2°F (+0.1°F)
- October: 72.8°F (+0.1°F)
- November: 62.8°F (-0.8°F)
- December: 54.5°F (+0.9°F)
I'll do the calculations for precipitation and snowfall later, but as you would expect in a warming climate, the majority of months' average high and low temperatures increased, with the notable exception of November (likely a result of several recent cool Novembers). Considering the finalized 1981-2010 normals increased from the raw data, it is likely that the climo high and low temperatures for all months will increase for every month except November.
- January: 31.5°F (+0.5°F)
- February: 33.8°F (no change)
- March: 40.0°F (+0.1°F)
- April: 48.5°F (+0.5°F)
- May: 57.4°F (+0.9°F)
- June: 65.7°F (-0.1°F)
- July: 69.9°F (no change)
- August: 68.5°F (-0.1°F)
- September: 62.3°F (+0.6°F)
- October: 50.0°F (+0.2°F)
- November: 39.6°F (-1.2°F)
- December: 34.2°F (+0.9°F)
And while I’m here, for all my Clemson peepsView attachment 61919
We just got our ass beat, so there’s thatI hope you get herpes. LOL