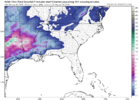
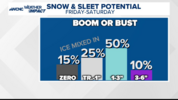
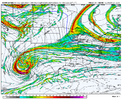
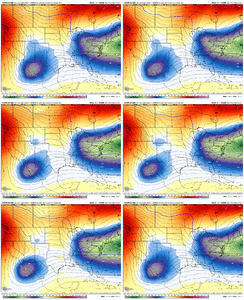
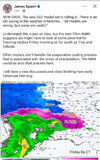
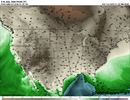
Single digit dews down to the NC/VA border with moisture en route usually gets it done
-
Hello, please take a minute to check out our awesome content, contributed by the wonderful members of our community. We hope you'll add your own thoughts and opinions by making a free account!
You are using an out of date browser. It may not display this or other websites correctly.
You should upgrade or use an alternative browser.
You should upgrade or use an alternative browser.
Wintry 1/9-12 Winter Potential Great Dane or Yorkie
- Thread starter SD
- Start date
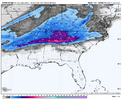
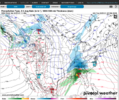
Look at those single digit dewpoints in VirginiaA winter storm is coming boysView attachment 160567View attachment 160568
albertwilsonjr
Member
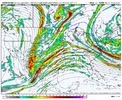
RU kidding me? A frigid 1030 high sliding in tandem to a CAD position. SLP off shore of Morgan City. Precip overspreading the SE.
Pinch me.
View attachment 160576
Can you explain what this would do
Sent from my iPhone using Tapatalk
accu35
Member
D
Deleted member 609
Guest
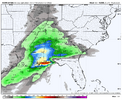
Frozen precip down into southern Georgia approaching from the west. Even we can’t mess this up.Single digit dews down to the NC/VA border with moisture en route usually gets it done
That was an amped system on the NAM which bodes well for the Middle and Deep South but not so well for folks in the eastern portion of the Southeast unless the low pressure track stays far enough east when it makes its run up the Atlantic coast to prevent warm air advection. I'd love to see a storm where everyone gets in on the action but they are very hard to come by.
SnowwxAtl
Member
Nit- picking...I don't like ATL dew point at 20...I need teens pleaseA winter storm is coming boysView attachment 160567View attachment 160568
The NAM is *really* close to a 1-2” smash of snow along and south of I20 very early on. I mean like one degree at the 700mb-850mb layer.
Should at least be sn to ip to zr in many of those locations, does it obliterate the CAD like the GFS did... who knows, we're trying to extrapolate the NAM which is dangerous lol. But that high is in a decent spot and the antecedent airmass is cold and very dry, which bodes well for areas east.That was an amped system on the NAM which bodes well for the Middle and Deep South but not so well for folks in the eastern portion of the Southeast unless the low pressure track stays far enough east when it makes its run up the Atlantic coast to prevent warm air advection. I'd love to see a storm where everyone gets in on the action but they are very hard to come by.
Don’t worry. They’ll only get warmer from here on the NAM. But you don’t need them this low to get it done so that’s a plus. There’s at least some wiggle roomNit- picking...I don't like ATL dew point at 20...I need teens please
Chattownsnow
Member
Seen the NAM dew point and wet bulbs often a verify higher at go time at this range but this certainly gives us all room to play with. I’m sitting at 10 degree dew point here. Trends are goodA winter storm is coming boysView attachment 160567View attachment 160568
**Note to our new members**
Take those snow maps being posted, especially those from Tropical Tidbits, with a huge grain of salt. They show all frozen precip as snow, meaning that even in location where it's sleet and/or freezing rain, those maps are calculating it as snow. Important to pay attention to precip types, etc take in numerous post/comments to get a better idea then a colorful snow map.
Take those snow maps being posted, especially those from Tropical Tidbits, with a huge grain of salt. They show all frozen precip as snow, meaning that even in location where it's sleet and/or freezing rain, those maps are calculating it as snow. Important to pay attention to precip types, etc take in numerous post/comments to get a better idea then a colorful snow map.
MichaelJ
Member
I want to remind everyone the NAM you are looking at is the 12KM which does not have a good resolution, when the 3K NAM starts getting in range, THAT is what I would key on.
Chattownsnow
Member
Meant dew point not wet bulb, editedSeen the NAM dew point and wet bulbs often a verify higher at go time at this range but this certainly gives us all room to play with. I’m sitting at 10 degree dew point here. Trends are good
I’m so used to just looking for a good winter pattern 15 days down the road that it’s weird seeing an actual winter storm on the NAM. It startles me a bit
But in simple terms, if the height lines are running from Wyoming to Arizona into the Baja low - Good NAM is in the good camp
If the lines are running from Wyoming to New Mexico - Bad (GFS like)
You can reference my post from 7pm or so as to why this is
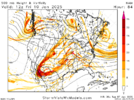
But in simple terms, if the height lines are running from Wyoming to Arizona into the Baja low - Good
If the lines are running from Wyoming to New Mexico - Bad
You can reference my post from 7pm or so as to why this is

That 20 degree DP should be sufficient enough since the 2m temp is 31 during that timeframe so we’ll likely wetbulb into the mid-upper 20s regardless as that northern fringe of precipitation moves in.Nit- picking...I don't like ATL dew point at 20...I need teens please
Stormlover
Member
that's a lot of in tsleetfreezing rain and some sleet that west Alabama area
Last edited:
Cad Wedge NC
Member
Well boys and girls, there's your cold air feed that so many were worried about... 1032 in WV sitting over snowpack. I'll take that all day.
That would do the trick if the storm follows the Euro model.Well boys and girls, there's your cold air feed that so many were worried about... 1032 in WV sitting over snowpack. I'll take that all day.
SnowwxAtl
Member
I know I was joking around...just saw dew points lower around ATL. Probably heat island effect.That 20 degree DP should be sufficient enough since the 2m temp is 31 during that timeframe so we’ll likely wetbulb into the mid-upper 20s regardless as that northern fringe of precipitation moves in.
Iceagewhereartthou
Member
I think dews that are too low is another bias of the long range NAM, maybe the NAM in general. Sometimes it gets it right but I think it often is too low; sometimes way too low. Still, add a few degrees to this map and many would still be in a good place; I mean single digits from CAE to AHN!
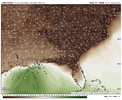
Maybe a met could chime in, but this really looks like the NAM is in the process of trying to ramp this thing up big time; if it went a few more frames. The convection near the gulf and the orientation of the transition line looks like a process of amplification; much like a bow echo radar in summer thunderstorms. If that is the case, we would not want that East of there.
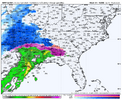

Maybe a met could chime in, but this really looks like the NAM is in the process of trying to ramp this thing up big time; if it went a few more frames. The convection near the gulf and the orientation of the transition line looks like a process of amplification; much like a bow echo radar in summer thunderstorms. If that is the case, we would not want that East of there.

UNCSC
Member
Snowflowxxl
Member
I’ve been negative as hell about this storm but even I have to admit things look good for the first time in 7 years.
One of the worries I've had for this system is the lack of a fresh source of cold air from the NE. That surface set up with a gulf low in that position and a decent meso high sliding into the Mid-Atlantic would keep the surface cold enough on a stiff NE and ENE CAD wind for Atlanta and the north and east burbs at a minimum. It should hold the snow change over to ZR longer after a nice initial thump.Can you explain what this would do
Sent from my iPhone using Tapatalk
If you look at the 500mb chart, the press from the northern stream out ahead of the low would be enough to keep the track flatter along the Gulf CoastI think dews that are too low is another bias of the long range NAM, maybe the NAM in general. Sometimes it gets it right but I think it often is too low; sometimes way too low. Still, add a few degrees to this map and many would still be in a good place; I mean single digits from CAE to AHN!
View attachment 160581
Maybe a met could chime in, but this really looks like the NAM is in the process of trying to ramp this thing up big time; if it went a few more frames. The convection near the gulf and the orientation of the transition line looks like a process of amplification; much like a bow echo radar in summer thunderstorms. If that is the case, we would not want that East of there.
View attachment 160582
iGRXY
Member
Blue_Ridge_Escarpment
Member
Been the theme of the day it seems.View attachment 160585
N/S is coming in stronger on the ICON as well
albertwilsonjr
Member
View attachment 160585
N/S is coming in stronger on the ICON as well
We keep this going, it’s gonna be a great snowstorm
Sent from my iPhone using Tapatalk
NBAcentel
Member
iGRXY
Member
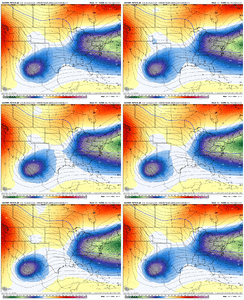
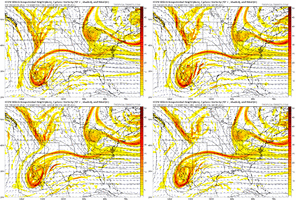
Is this what you mean grit? re: less lines (contours) from WY to NM but better for WY to AZ?View attachment 160588View attachment 160589Pretty noticeable trend with our S/W on the icon. It’s applying to the EC AI slowly as well
Baja west. Kicker east. 4 runs in a row.View attachment 160588View attachment 160589Pretty noticeable trend with our S/W on the icon. It’s applying to the EC AI slowly as well
iGRXY
Member
iGRXY
Member
Lord the ICON is colder at 850 too. This could be an all snow event along 85 this run
Looks warmer to me at 90?Lord the ICON is colder at 850 too. This could be an all snow event along 85 this run

