accu35
Member
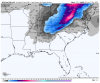
This is the clipper which has been trending west


Once again, misleading
Certainly could be some flurries tho View attachment 59288View attachment 59289
Once again, misleading
Certainly could be some flurries tho View attachment 59288View attachment 59289


Here’s the slightly better 3h View attachment 59298
See now I have a reason to fly back home from Montana to Tuscaloosa for Christmas if that happensI can't seem to post college DuPage, but gfs has snow shower deep into Alabama this run. Even have .4 snow cover around Tuscaloosa area .can someone post that image?
Hmmm, I think the GFS when you look deeper into it's moisture profiles looks a lot like this....it shows moisture getting into SC from the backend energy, even if it doesn't necessarily show it on the precip maps. I wouldn't be that surprised if parts of SC got flurries on the backend.


CMC is definitely more ideal at H5, would probably be some Convective snow showers underneath that deep H5 cutoff for much of the areas around the base of it, GFS is farther north and isn’t as good View attachment 59300View attachment 59301
Damn more severe for maybe some clipper SN showers, do I want that tradeoff ? LolI posted the long range NAM trending south/more amped in the severe thread, but it’s also good for this. If we can get this upper level low far enough south and well tilted, we could get some clipper snow showers Christmas day. Maybe.
I’m liking the trends for a few flakes here!I posted the long range NAM trending south/more amped in the severe thread, but it’s also good for this. If we can get this upper level low far enough south and well tilted, we could get some clipper snow showers Christmas day. Maybe.
Time to spend Christmas with Dolly, at Ober GatlinburgHuge increase for Central/North Al
Nam actually has some back side flurries. Interesting but probably inaccurate
Sent from my Pixel 3 using Tapatalk


I wonder how they come up with this map. Looks nothing like weatherbell gfs end mapHuge increase for Central/North Al
Exactly this, those TT 6 hour maps are stupidly deceivingI think these 6 hr maps are deceiving. I'm not sure how much backside snow the GFS/GGEM are actually showing, even west of the Apps. In many cases, to me it looks like precip has already cleared out of the area for the most part before the changeover happens, but the clown maps aren't showing this. The trends are good still, but we need to see more.
I still think backside flurries and snow showers are doable for many, but some of these snow maps I'm seeing just don't look realistic at all to me.
I’m assuming COD uses the same thing TT does with 6hr maps, so it’s sorta deceiving on there, as that over-inflates the meanLooks way different than the dupage map.
Lee side trough potential? ??One of my favoritesUKMET View attachment 59309View attachment 59310
IMO there would probably be more flurries/snow showers then it shows under this strong cutoff, can clearly see the packet of moist 700s under it,here’s a sounding under it as well, clearly shows a sounding supportive of snow showers/flurries View attachment 59311View attachment 59312


?Lee side trough potential? ??One of my favorites


And so far it's pretty much alone on that. Other models show the flizzard plus ENSNo go for a flizzard View attachment 59323


.png")

looks like Athens/Sweetwater North get clobbered.. I've seen this happen before. (Mrx busting on the low end, I mean. )06z GFS pops a low in Eastern Alabama and sends it up the Lee side of the Apps where it crushed Tennessee. The Canadian/RGEM/GFS/GFSV16/NAM all pop the low well south of Tennessee, the Euro/UKIE pop it toward Bluefield, WV the last couple of runs. Where it forms has major consequences for Tennessee/Georgia/Alabama.
View attachment 59360
looks like Athens/Sweetwater North get clobbered.. I've seen this happen before. (Mrx busting on the low end, I mean. )

.png")
