• Hello, please take a minute to check out our awesome content, contributed by the wonderful members of our community. We hope you'll add your own thoughts and opinions by making a free account!

Wintry More SE Snow ? (1/16-1/18)

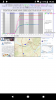
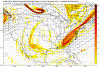
Why do CURRENT wx maps have a 1051 high over the N Plains when in reality it is only 1045? Also, all major models have been initializing off of a 1055-6 high as of 18Z when in fact it was then only 1047. Is this a concern as far as the accuracy of the models and, therefore, what would that portend for this wintry event? Wetter? Warmer? Anything?

View attachment 3024

I see 1052mb at the Montana/North Dakota border.
8781B46E-5E60-4566-B582-01193F190DC2.gif
 
A couple days ago I would have painted 3"+ potential from GSO to RIC, now it looks like Wake Forest to Emporia. There should be a band from CLT to GSO that may over-perform but at this point, Roanoke Rapids is in a very good spot if the upper levels continue to trend. We usually see systems trend away from us inside day 5, I am a big believer though in the 48-120hr dead period where guidance loses events just to bring them back in a slightly more amped version come verification. While this is by no means a rule, it seems to happen with some frequency and without a good explanation.
I support this post. I really think 3 to 4 here is a good bet.
 
I see 1052mb at the Montana/North Dakota border.
View attachment 3026

Thanks very much for responding. Something isn't jibing. I see the 1052 on your map at/near Williston as well as low 1050s all around the area. But check out these surface reports located at this link:

http://kamala.cod.edu/nd/latest.asus43.BIS.KBIS.html

The latest has Williston at only 30.83", which is only 1044 mb! 1052 mb is 31.07".

WILLISTON CLOUDY -17 -24 70 CALM 30.83F

Can anyone figure this discrepancy out?
 
Is this system essentially upper level in nature vs a coastal low?

Performance is entirely dependent on the upper levels in this setup, coastal would be a kicker for those east of 95, mainly NE NC & SE VA given the late bloom, whereas most are looking for a minor Gulf tap and help with a mid level wrap up. I was telling the guys at work we like to see a surface reflection off the GA/SC coast at this stage and the consensus is the coastal takes form too late off HAT to be consequential. There could be some ATL enhancement of the band as it moves east but its more of a hybrid, especially if we have some Gulf moisture.
 
3 things I am watching for tonight's runs
1. Continued improvement at 500mb
2. Watching to see if and where that jet streak forms (imho this is VITAL for precip in central and southern AL into GA and into the Carolinas)
3. Will we generate more QPF
 
Does anyone think that 1/9-10/1962 MIGHT be an analog for this for ATL and RDU?

http://library.noaa.gov/Collections/Digital-Documents/US-Daily-Weather-Maps

Like now, the PNA, NAO, and AO were solidly + while the EPO was pretty neutral. ENSO was then cold neutral, which isn't too far off the current borderline weak/moderate La Nina. Like for this one, there was no Gulf surface low and there was a SW-NE oriented band of overrunning behind a very strong cold front though the surface high of 1/1962 was much stronger at 1060 mb vs the current one of only 1045 mb. Like for this one, surface winds at ATL were NW.

Here's a 500 hPa animation for that event using ERA-20C... There are some distinct differences between this upcoming event and January 1962, namely the s/w at the base of the trough was much further west when it entered the US and dug all the way down into Arizona and the entire longwave trough washed out during the course of the event, pretty classic overrunning setup in general, albeit it would be even more classic if the wave was embedded in the southern stream and came into the US thru California and ran into a big, cold vortex over SE Canada & the Great Lakes.

Jan-1962-US-500-hPa-animation.gif


January 10-11 1962 NC Snow map.png
 
Speculation is that the new NAM will probably show a stronger mid level low, probably closed off, and some SFC reflection on the 00z run ... just based on what I am hearing with the 21z SREF
 
SREF for central Bama went down, then up then down , then up and now back down. Nothing consistent. Awesome

Sent from my SM-J320VPP using Tapatalk

It actually remained relatively unchanged here, maybe a tick less but the boom potential member is over 2.5".
 
HSV SREF mean down slightly from 1.2 to 1.0. I like this graph to see the trends over the past 4 runs.
 

Attachments

  • Screenshot_20180115-192651.png
    Screenshot_20180115-192651.png
    636.2 KB · Views: 51
I
Performance is entirely dependent on the upper levels in this setup, coastal would be a kicker for those east of 95, mainly NE NC & SE VA given the late bloom, whereas most are looking for a minor Gulf tap and help with a mid level wrap up. I was telling the guys at work we like to see a surface reflection off the GA/SC coast at this stage and the consensus is the coastal takes form too late off HAT to be consequential. There could be some ATL enhancement of the band as it moves east but its more of a hybrid, especially if we have some Gulf moisture.
i live in SE VA going with 1-3” right now hope it ends up being 2-4”
 
Slight possibility of every county in Alabama getting measurable snowfall from one system. Pretty rare occurrence. For some reason I think every county was under a heavy snow warning for parts of the 93 storm. Could be wrong about that. Hope I was the first to make a super storm comparison
 
21z sref for Alabama Mean/averages
Muscle Shoals 1.36 inches
Meridianville 1.16 inches
Huntsville .95 of an inch
Ft. Payne .60 of an inch
Auburn .59 of an inch
Cullman .56 of an inch
Montgomery .47 of an inch
Anniston .42 of an inch
Alexander City .42 of an inch
Gadsden .32 of an inch
Dothan .12 of an inch
 
3 things I am watching for tonight's runs
1. Continued improvement at 500mb
2. Watching to see if and where that jet streak forms (imho this is VITAL for precip in central and southern AL into GA and into the Carolinas)
3. Will we generate more QPF

I would add watch the upper low near the US Canadian border. Each model that closes off the our upper system is farther north with this system and aren't flattening the ridge nearly as quickly.
 

Attachments

  • GFS.png
    GFS.png
    213.1 KB · Views: 34
  • CMC.png
    CMC.png
    197.9 KB · Views: 33
  • Icon.png
    Icon.png
    215.3 KB · Views: 32
  • NAM.png
    NAM.png
    223.3 KB · Views: 33
Thanks very much for responding. Something isn't jibing. I see the 1052 on your map at/near Williston as well as low 1050s all around the area. But check out these surface reports located at this link:

http://kamala.cod.edu/nd/latest.asus43.BIS.KBIS.html

The latest has Williston at only 30.83", which is only 1044 mb! 1052 mb is 31.07".

WILLISTON CLOUDY -17 -24 70 CALM 30.83F

Can anyone figure this discrepancy out?

I just got the answer. Those hourlies are altimeter based pressures and not SLP's. They aren't taking into account temperatures is what I was told. I need to google this and learn more about it. I always assumed that the hourly city by city readings were SLPs. I was wrong! That's why the maps have higher pressures and they're correct. The highest SLP today at williston was 1053.1 mb (13Z today). I'm honestly not believing I just discovered this.

Edit: Williston's 1053.1 still verified lower than the models' 1056 mb.
 
Last edited:
Speculation is that the new NAM will probably show a stronger mid level low, probably closed off, and some SFC reflection on the 00z run ... just based on what I am hearing with the 21z SREF
Is this good for Columbia or bad?
 
21z SREF for RDU after removing the one member w/ 10" lol. Important thing to note here if anything is that most of the members show anything between 1-4" but the mean definitely went up substantially. Again it is the SREF so take it w/ a grain of salt.

It is, most of NC sees a 1-3" event on the 21z SREF, ARW is a little more amped as usual. Clicking through the stations the mean is not picking up on the gaps, some will see a dusting while others will see closer to 2-3". That's about the cap at this point, anyone who verifies more will be deemed fortunate.
 
Back
Top