• Hello, please take a minute to check out our awesome content, contributed by the wonderful members of our community. We hope you'll add your own thoughts and opinions by making a free account!

Wintry Winter Discussion 2023/24

The GFS has been too warm dating back to Summer at least. It is consistently busting high on temps at least around my neck of the woods
Which is interesting because it seems like for a number of years the GFS has had a warm bias in the summer and cold bias the further we get into fall and winter.
 
Interesting graphic on CNN.com today showing differences in snowfall from the 70s to now. Surprised to see the big increases along the coast, but I guess warmer waters means more amped coastal lows?

Worrisome trend when you think about the ski resorts in WV, VA, NC, and TN
 

Attachments

  • Snowfall is changing across the globe, new maps show  CNN.jpeg
    Snowfall is changing across the globe, new maps show CNN.jpeg
    120.3 KB · Views: 117
Interesting graphic on CNN.com today showing differences in snowfall from the 70s to now. Surprised to see the big increases along the coast, but I guess warmer waters means more amped coastal lows?

Worrisome trend when you think about the ski resorts in WV, VA, NC, and TN

Interesting. Tend to think most of the differences between the Rockies and Apps can be attributed to the PDO/AMO combination in the 60s/70s/80s vs now. Think you're right on warmer water temps boosting storms for the coastal areas.
 
Last edited:
Interesting graphic on CNN.com today showing differences in snowfall from the 70s to now. Surprised to see the big increases along the coast, but I guess warmer waters means more amped coastal lows?

Worrisome trend when you think about the ski resorts in WV, VA, NC, and TN
The NC numbers are down the most. WV still doing well.
 
Miracle snow

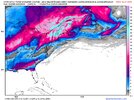
gfs_mslp_pcpn_frzn_us_60.png
 
If the teleconnections and ensembles are on to how the first 10 days of December play out, there might really be a lot of busted monthly forecasts. While it’s not showing anything extremely cold, the biggest takeaway when looking at them is that there is nothing to indicate an extended stretch of above to well above average temperatures.
 
Experimenting with something new tonight. Having one of those very late night coding sessions (usually when I do my best work).

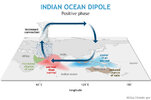
This is what the historical tercile summaries look like for El Niño events since 1855, weighted more heavily towards analogous events that were accompanied by a positive Indian Ocean Dipole (+IOD), negative Pacific Decadal Oscillation (-PDO), early winter -NAO, and a positive Atlantic Multidecadal Oscillation (+AMO), or warm Atlantic.

In essence, this provides you with a true apples-to-apples comparison of Climate Prediction Center (CPC) probabilistic winter outlooks to what has historically occurred in El Niño winters like this over the last 150+ years or so.

The plots will look a little noisier than the ones I've shown previously because I'm looking at finer-scale details in the local probability distribution at each point.
(i.e. splitting the data into thirds/3 parts instead of 2 equal halves yields slightly noisier data).

Here I've only looked at February, but I'd be curious about what other months show.

I plan to take a look at ERA-5 reanalysis monthly snowfall data (which goes back to 1940) at some point tomorrow and perform the same analysis (or in this case I guess today because it's already past local midnight here).
Feb_Nhem_500mb_CPC_Prob_Nino_Analog_crop.png


Feb_Analog_CPC_Temp_Prob_Composite_crop.png
 
Now the map that most everyone here has probably been waiting for:

Snowfall tercile summaries (CPC-like probabilities) across the CONUS for El Niño winters since 1940 using ERA-5 reanalysis:

View attachment 138182

Same analysis, but over the entire Northern Hemisphere. It tends to get quite snowy over much of Eurasia during El Niños, esp over the Tibetan Plateau of western China.


NHEM_NDJFM_CPC_Snow_Prob_El_Nino_Composite_crop.png
 
Well my first chance at some flakes at least maybe

Saturday Night
Rain in the evening, then rain and snow likely after midnight. Cold with lows in the lower 30s. Northeast winds around 5 mph, becoming northwest 10 to 15 mph after midnight. Chance of precipitation 90 percent.

Well it did snow in the cityScreenshot_2023-11-26-11-07-33-46_a23b203fd3aafc6dcb84e438dda678b6.jpg
 
Fwiw, these are the (weighted) analogs I came up w/ for this winter & posted about on twitter/"X" a few days ago. I weighed more intense El Niños, El Niños accompanied by a positive Indian Ocean Dipole (+IOD), negative Pacific Decadal Oscillation (-PDO), a neutral - negative NAO in December, and a warm Atlantic (+AMO) more heavily than other Ninos.

Even when you account for things like long-term climate change and changes in instrumentation/measurement & sampling techniques over the record, this subset of years paints a rather cool/stormy picture across the southern tier of the US.

Snow is obviously a whole different animal. While I didn't factor the background warming of the climate into the ERA-5 (CPC-like) probability composite shown below, you definitely get the idea that things are really leaning in our favor this year regardless.

F_okICbXsAA77Mb.jpeg


F_okN9XWkAAKCTt.jpeg


F_okLtqWMAA8hly.jpeg


F_okPUcWUAErVMm.jpeg


F_4wheiWgAAppqF.jpeg
 
Fwiw, these are the (weighted) analogs I came up w/ for this winter & posted about on twitter/"X" a few days ago. I weighed more intense El Niños, El Niños accompanied by a positive Indian Ocean Dipole (+IOD), negative Pacific Decadal Oscillation (-PDO), a neutral - negative NAO in December, and a warm Atlantic (+AMO) more heavily than other Ninos.

Even when you account for things like long-term climate change and changes in instrumentation/measurement & sampling techniques over the record, this subset of years paints a rather cool/stormy picture across the southern tier of the US.

Snow is obviously a whole different animal. While I didn't factor the background warming of the climate into the ERA-5 (CPC-like) probability composite shown below, you definitely get the idea that things are really leaning in our favor this year regardless.

View attachment 138185


View attachment 138187


View attachment 138188


View attachment 138186


View attachment 138191


Here's what precipitation looks like in ERA-5 for all El Niños (top) and these analogs (bottom).


F_5vpfiWMAADdB7.jpeg


F_5zD-gW0AACa-i.jpeg


Not all that far off from the latest CPC and C3S Ensemble Mean Forecasts.

off01_prcp.gif


ps2png-worker-commands-76898cbbf-bq7dx-6fe5cac1a363ec1525f54343b6cc9fd8-2OmAb_.png
 
Back
Top