D
Deleted member 1449
Guest
Someone just got lolipopped NAMed

*Raises hand* ?
That does not look like tonight's 0z run, its bone dry.... last night's maybe?

No dats it..mountain maulerThat does not look like tonight's 0z run, its bone dry.... last night's maybe?
Yep sure is, I thought he was referencing the Wednesday night system that ain't happening lol. My goofNo dats it..mountain mauler
Ha! Look at those 5" totals just to my NE, yeah NAM sure...Nam totals
View attachment 32467
All good. I’m pretending like I’m a mountain poster this week since I’m headed above 4K for the weekend...I’m being a ?Yep sure is, I thought he was referencing the Wednesday night system that ain't happening lol. My goof
Go to beech or roan that's the only way I see you salvaging your trip grandfathers 20 bucks I'd go to carvers gap/roan it's higher along the line so you'll get NW flow too great trail open balds with spectacular views.All good. I’m pretending like I’m a mountain poster this week since I’m headed above 4K for the weekend...I’m being a ?
How serious do we take the NAM when global guidance is saying rain? I just don’t model watch much for the mountains so I’m not sure what to thinkExcellent 12Z NAM run for the foothills and mountains.
Never take the NAM serious near the end of its range. I only use it 1 to 2 days out.How serious do we take the NAM when global guidance is saying rain? I just don’t model watch much for the mountains so I’m not sure what to think
Although the globals show rain, a lot of times the NAM is good at picking up on small details such as a meso high. Not saying it’s right this time, but it does tend to do well in this timeframe with details such as just mentioned.How serious do we take the NAM when global guidance is saying rain? I just don’t model watch much for the mountains so I’m not sure what to think
How serious do we take the NAM when global guidance is saying rain? I just don’t model watch much for the mountains so I’m not sure what to think


Hazardous Weather Outlook
National Weather Service Greenville-Spartanburg SC
650 AM EST Fri Jan 31 2020
NCZ033-048>053-058-059-062>065-011200-
Avery-Madison-Yancey-Mitchell-Swain-Haywood-Buncombe-Graham-
Northern Jackson-Macon-Southern Jackson-Transylvania-Henderson-
650 AM EST Fri Jan 31 2020
This Hazardous Weather Outlook is for western North Carolina.
.DAY ONE...Today and tonight.
A brief period of snow is possible after the onset of precipitation
sometime later this morning through the afternoon. This is most
likely above 3000 feet, although locally lower, especially across
the escarpment into the Blue Ridge mountains. A quick dusting to an
inch will be possible, before transitioning to rain. Snow will likely
continue above 5000 feet with a few inches possible.
.DAYS TWO THROUGH SEVEN...Saturday through Thursday.
Snow showers will continue Saturday into Saturday night. Snow levels
around 5000 feet during the afternoon are expected to fall to around
2500 feet before coming to an end Saturday night. Additional light
accumulations will be possible, mainly above 3500 feet.
Ray has hoisted the light snow snowman meter on his site..looks like a general 2-3” with a shot at higher amounts above 5k feet..Jimmy Deluxe!
Can’t wait to close this horrible thread tonight
Sent from my iPhone using Tapatalk


You did well the folks in south central south Dakota want you to start anotherWhoever started this thread should be black listed from creating another thread.
View attachment 32717View attachment 32718
That min temp is so terrible for January.Barring anything crazy it looks like I'll wrap up January like this
Max: 71.9
Min 22.1
Avg 46.5 +5.5
5.75ish rain
0.00 snow

Worst of the last 3. 8, 5, 4 in 2018 17 3 days in a row last year really show how warm this year wasThat min temp is so terrible for January.
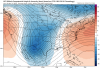
So just to try it. I believe this is what Maxar was doing that @GaWx mentioned but maybe he can clarify. (oddly enough my results are nowhere close to what they were mentioning?)
This is taking the Date centered on the CPC 8-14 day analog (1/12/19) and using the 9 analog dates in the chart to generate a +20 day composite for 2/1/19...
Behold.
View attachment 29503
Going forward in time only TWO days, gives me this (went forward 2 days in each composite year, making this the supposed forecast for 2/3/2020 based on CPC's analog year composite)
View attachment 29504
2/4/2020
View attachment 29505
2/5/2020
View attachment 29506
2/6/2020
View attachment 29507
you get the idea. If we were to make a 4 day composite of those last 4 images, we would have quite possibly the coldest best pattern ever. So are we to expect that Feb 3-6? ...common sense would be screaming no.
So I used to do this and provide animations of the predicted pattern, etc. 9 times out of 10 some wild blockbuster pattern showed up and I thought I was onto the next generation of weather forecasting...problem was these composites never materialized.
We'll compare these next month and see how well they did. The issue is CPC 8-14 day analogs will create a centered date of 01/13/19 today and the composite years will be changed, which will change these maps and thus another solution for a period only 1 day different in lead time...