BPATL
Member
Look at this current temp map, something wrong with that picture....
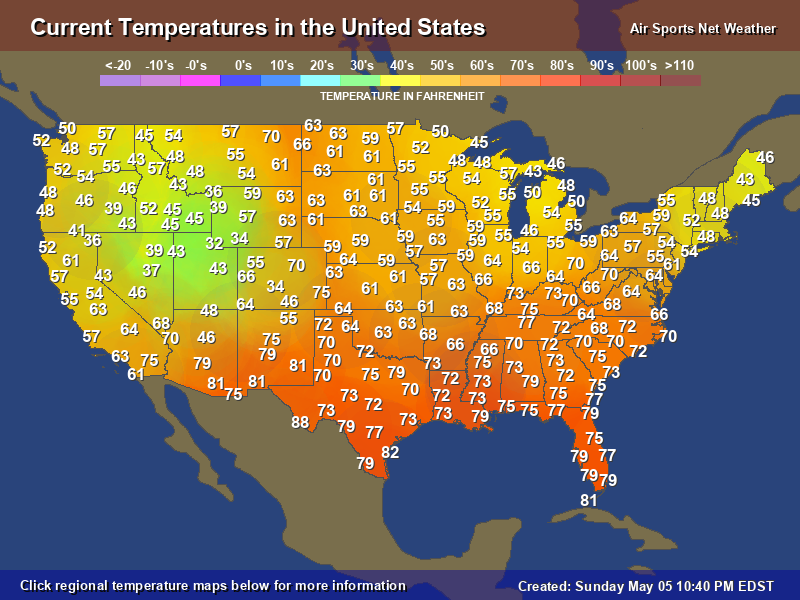
I would.Would you rather it be 38 and raining like it is here ?
KATL ending up with the record warmest Feb (since 1879) is now a virtual certainty. The latest Radiant Solutions (pro met group) forecast is for an incredible 57.4 (same as Tuesday forecast and ~10 F above normal), which would obliterate the current warmest Feb of 56.1 (set just last Feb.). There is still a chance at tieing or beating the warmest met winter month on record of 57.6 (Dec of 2015) since the forecast is so close now. Amazing times in wx history!
Edit: today's KATL low of 65 ties the warmest low on record (back to 1879) for ANY day between 12/29 and 3/17, inclusive!

At first I thought you must have the wrong information for the all time high in February for Chattanooga but you are indeed correct. It’s strange because White House has hit 80+ degrees twice in the history of February. We hit 81 in 1962 and 82 in 1996. During this current record warmth I’ve reached 75 and 78 on the warmest days so far.I know for sure we tied our all time Met Winter temp of 79.. we may have clipped 80.
Well it is looking more and more likely that it will be cold to start the month of March.King Jon told me I had to post in here! That non existent SE ridge, is really non existent! Marvelous March will save us Jon said it’s gonna be cold, so it has to be!
Yeah, 5-10 below avg high will be awesome! Put me at 50-55 chilly degrees for highs at GSPWell it is looking more and more likely that it will be cold to start the month of March.
Yeah, 5-10 below avg high will be awesome! Put me at 50-55 chilly degrees for highs at GSP
yep, based on NWS's NOWDATA, which has CHA's weather history going back to 1879.. I'm there a lot, looking stuff up.At first I thought you must have the wrong information for the all time high in February for Chattanooga but you are indeed correct. It’s strange because White House has hit 80+ degrees twice in the history of February. We hit 81 in 1962 and 82 in 1996. During this current record warmth I’ve reached 75 and 78 on the warmest days so far.
 Another unfortunate side effect of Fab February
 Today at my location will make the 7th 80+ in a row and the 10th of the last 11 being 80+! Much of the SE will end up with its warmest Feb on record (since 1870s) by a wide margin beating last year. At least we have that to talk about. Getting the warmest met winter month on record will of course be tougher but is still possible in some areas. Amazing times we're living in and an amazing winter here going from coldest week in 41 years first week in Jan (along with biggest winter storm by far in decades) as well as an overall cold Jan to record warm Feb by wide margin! I think the analogs (at least what I considered analogs before the winter started) have had a good winter for a change. No "butts" about it, Mack.
It is already 83 at noon here! Can you say all time record high for entire met winter in danger of being tied or even broken? That record is 86.

Congrats !It is already 83 at noon here! Can you say all time record high for entire met winter in danger of being tied or even broken? That record is 86.
Edit: Actually, from Nov 3rd thru March 8th, SAV has not had anything warmer than 86 since records started in the 1870s!
Get off the crack you guys! (just kidding of course)Don't say you've given up yet ...
Soon, but cigars are still at the bar ...

Larry,
Records, and aberrations, especially those like what we're currently experiencing, though disconcerting, are interesting, as is most weather, so long as there is no resulting loss of life, limb or property associated with the phenomena; in this case, some warm weather, though not "fun", is at least "safe" ... however a long term early Spring cold spell would be far more enjoyable, and interesting, IMHO ...
And we may just get something akin ...
View attachment 4222
Best!
Phil
Gainesville is the new Miami..Thank the Good Lord this month has less than 6 hours to go ...
Bye FeliciaGoodbye weird ass Februrary!