3km NAM jet is a good bit further north than 12z Euro with upper jet streak. But it does seem to be enhancing precip.


If does I'll be under a boatload of zr probably
Unfortunately, thats possible ... thats why I said yesterday your Hot line is Riedsville - Williamsburg VA that allowed for the inevitable NW trend occurring ect. Someone in that line will be the winnerIf does I'll be under a boatload of zr probably
But the EPS has been dogwater for 36hrs ? Like its getting close to absolutely nothing lolRGEM on top of EPS…tough to beat. I’ve been NAM’d enough to know better.
View attachment 170123View attachment 170124

Well if you look at the AI, GFS, ICON, CMC, Euro/EPS, RGEM they are all in the same ballpark.But the EPS has been dogwater for 36hrs ? Like its getting close to absolutely nothing lol
Water is crazy up there. When we go in July it can be frigid dark water one day and be like a hot tub with aqua blues the nextCan not find where I read it but anomalies are toasty, I was just as surprised. Poor OBX they will never warm up with those frigid blues
View attachment 170108
preface: I could wrong but,
It's hard to beat ICON/GFS/Euro/EPS/AIFS/Rgem combo on the qpf field when they all agree with each other.
95% chance the cam's/hi res models will correct to them.
The question is, when they do, what will the banding/qpf field look like? It could still be more robust than the globals, imo. It'll be nice when they do come in line so we can see where the preferred mesoscale banding/jackpots are setting up. Also will help us determine where the P-type lines are setting up too.. can't tell anything when the hi-res models are so far off on the main features and we know the globals aren't the best with drawing those boundary lines.
I did notice the NAM made a big shift within the qpf field over missouri within 24 hrs of go time. A random city went from .03qpf to .27qpf forecasted in one cycle. They were previously in a minima zone/screw hole and that flipped to a jackpot zone.Wonder how that activity in the plains is doing compared to modeling
Given that info Jamie Arnold who is a meterologist down in Myrtle Beach has this map for the winter storm he posted this on Twitter about 2 hrs ago. Agree or Disagree?:preface: I could wrong but,
It's hard to beat ICON/GFS/Euro/EPS/AIFS/Rgem combo on the qpf field when they all agree with each other.
95% chance the cam's/hi res models will correct to them.
The question is, when they do, what will the banding/qpf field look like? It could still be more robust than the globals, imo. It'll be nice when they do come in line so we can see where the preferred mesoscale banding/jackpots are setting up. Also will help us determine where the P-type lines are setting up too.. can't tell anything when the hi-res models are so far off on the main features and we know the globals aren't the best with drawing those boundary lines.

Definitely a little stronger precip field at hr 42 as a result.

Yeah, the thing is these types of shifts happen all the time with rain storms, it’s just no one cares about the difference between 0.05” of rain and 0.25” of rain. But in snow terms it’s a bigger difference…between a coating and 2-3”.I did notice the NAM made a big shift within the qpf field over missouri within 24 hrs of go time. A random city went from .03qpf to .27qpf forecasted in one cycle. They were previously in a minima zone/screw hole and that flipped to a jackpot zone.
You just never know, lol.
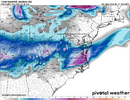
That energy came fully onshore just today so who knows?Did the American models ingest something at 18z the others didn’t? Because the GFS looks like it’s going to be a lot juicier, too.
GFS leading us to victory
 take it to the bank and deposit
18z GFS is absolutely juiced for the upstate.... dang. Everybody gets at least .18 inches of liquid of some area's get .30, all before 1pm.
This is the way for us!
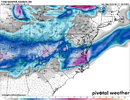
Ended up pretty similar in lots of places compared to 12z.Did the American models ingest something at 18z the others didn’t? Because the GFS looks like it’s going to be a lot juicier, too.


Sneaky move there!

Yeah, I didn’t remember the 12z was pretty good for the Western Piedmont, too. The American guidance is certainly a lot better out that way (SREF included) compared to the foreign modeling. Not as much difference out towards the Triangle.Ended up pretty similar in lots of places compared to 12z.
View attachment 170140

Way off. No ice for the upstate. Don't mean to roast him, but woof. He probably just didn't spend much time looking at what the upstate area.Given that info Jamie Arnold who is a meterologist down in Myrtle Beach has this map for the winter storm he posted this on Twitter about 2 hrs ago. Agree or Disagree?:
View attachment 170136
 ️
️If these trends continue you may just get you an inch or two fro! If its drastic changes maybe even 3-4Some things just don’t make sense, and the GFS QPF depiction makes sense with the broad warm air advection regime View attachment 170141