Five Times:Has that ever happened before?
- 1892 - 1894
- 1908 - 1910
- 1954 - 1956
- 1973 - 1975
- 1998 - 2000
Ensemble Oceanic Nino Index
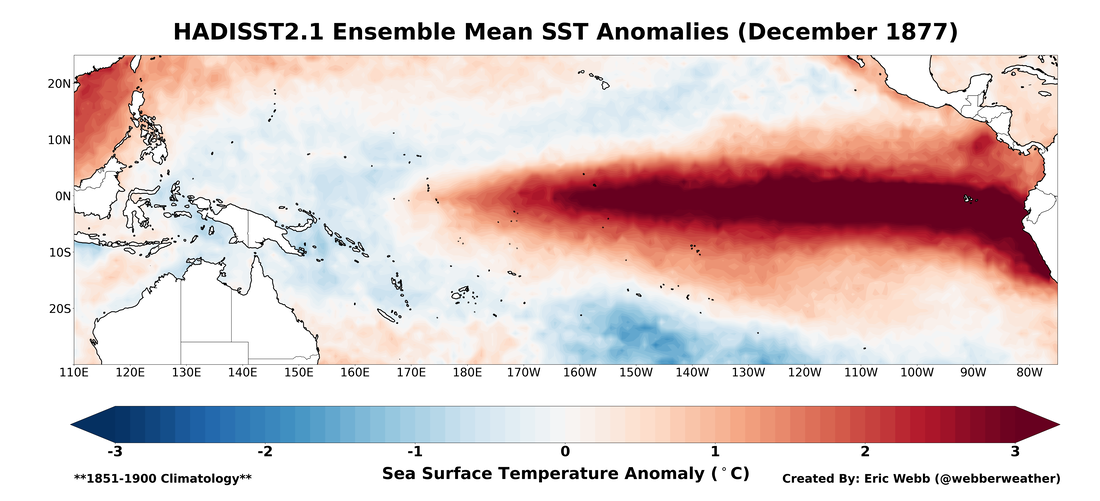
Figure 1. December 1877 Tropical Pacific sea surface temperature anomalies via HADISST2.1
www.webberweather.com
.png")