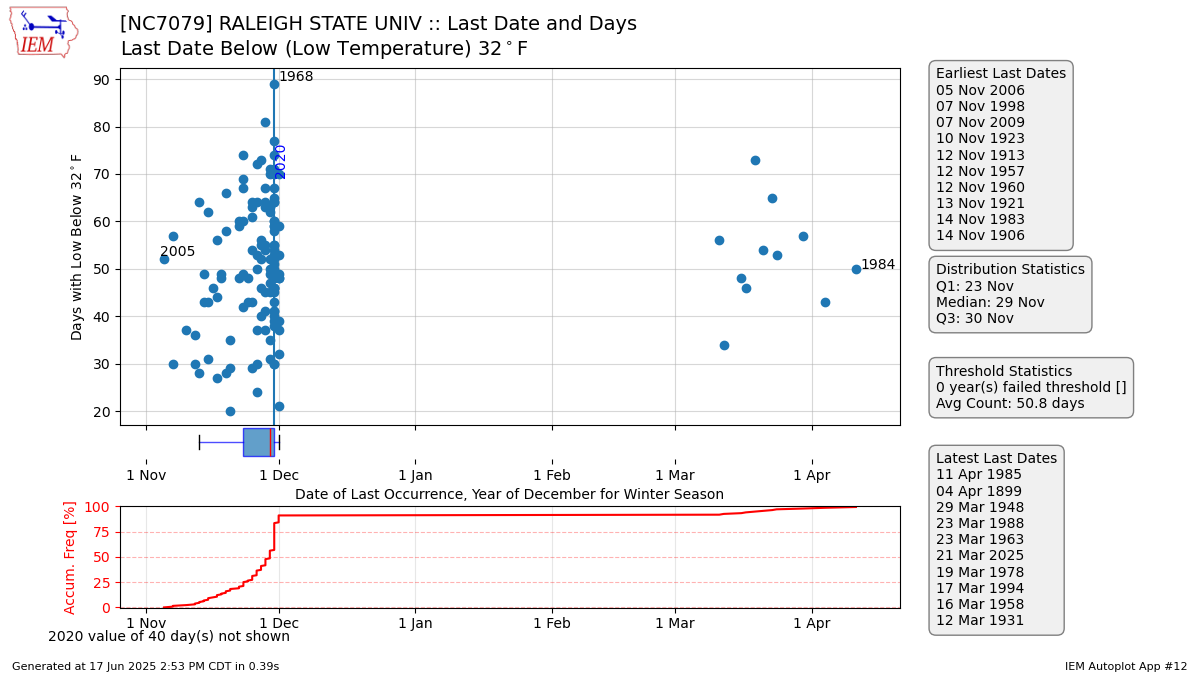
God bless the IEM data plotter. For the NC State climate reporting site
On a certain date, what is the chance a temperature below a certain
threshold would be observed again that spring season
DOY : Date : chc <33 : chc <29 : chc <27 : chc <23
On a certain date, what is the chance a temperature below a certain
threshold would be observed again that spring season
DOY : Date : chc <33 : chc <29 : chc <27 : chc <23
62 Mar 02 97 77 61 27
64 Mar 04 96 72 56 24
66 Mar 06 96 70 52 20
68 Mar 08 95 64 48 17
70 Mar 10 93 58 42 14
72 Mar 12 88 53 38 10
74 Mar 14 87 50 34 10
76 Mar 16 84 45 31 7
78 Mar 18 79 38 24 6
80 Mar 20 75 31 17 3
82 Mar 22 73 26 13 3
84 Mar 24 65 20 13 2
86 Mar 26 59 16 10 2
88 Mar 28 58 11 6 0
90 Mar 30 48 8 3 0
92 Apr 01 45 7 3 0
94 Apr 03 38 6 2 0
96 Apr 05 34 5 2 0
98 Apr 07 29 3 2 0
100 Apr 09 25 3 1 0
102 Apr 11 17 0 0 0
104 Apr 13 13 0 0 0
106 Apr 15 10 0 0 0
108 Apr 17 3 0 0 0
110 Apr 19 2 0 0 0
112 Apr 21 0 0 0 0
114 Apr 23 0 0 0 0
116 Apr 25 0 0 0 0
118 Apr 27 0 0 0 0
120 Apr 29 0 0 0 0
 global warming really screwing us in that department