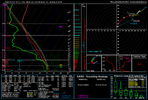
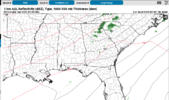
• Hello, please take a minute to check out our awesome content, contributed by the wonderful members of our community. We hope you'll add your own thoughts and opinions by making a free account!

Severe 3/1-4 SEVERE WEATHER

Does Newport Tn get any bad weather? Not talking about snow
 
Is there a source to learn how to read these? I don’t know how to do that yet but want to learn
I'd be happy to help you. I would send you a private message, but I think it's best to do it on the public forum so others may also learn something. What questions do you have specifically, or what concepts do you want to be explained? I see you said you cannot grasp soundings, so I'll give a little primer on those. My strengths are NWP (numerical weather prediction.. so weather models) and severe weather forecasting.

What is a sounding exactly?
A sounding profile is simply a vertical profile of the atmosphere. When a meteorologist releases a weather balloon, it rises into the atmosphere and records various bits of data at each level (temperature, dewpoint, winds, etc). The raw data is fed back to the NWS who has software that automatically plots this data onto the sounding profile. Models also forecast that data at many vertical levels, so it's now possible to see a simulated forecast sounding generated by software that can translate the raw model data into the graph.

How do you read a sounding?
I'll use the most common sounding profile nowadays which is generated by a software called sharppy (pic below.. this is a sounding from Tuscaloosa AL before their EF-4 tornado on April 27, 2011.. so a classic "perfect" significant tornado sounding).
View attachment 129676

I'll first call your attention to the main panel on the top left with the vertical green and red lines. The red line depicts the vertical temperature profile, the green line depicts dewpoint. The temperatures along the x axis are skewed (this, as most soundings, is called a skew-t), so to find a line of equal temperature, it's the lines that are in the background that extend from the number on the x-axis up to the up/right. For example, look at the 0 on the x axis, and follow the thin dark blue line that extends from right above that 0 up thru the green and red lines and to the top right of the panel. That line indicates 0 degrees Celsius. So where that line intersects the red line, the temperature is 0 degrees C at that level, and where that line intersects the green line, the temperature is 0 degrees C at that level. Each temperature level (from -50 to 50 C) does the same thing. The curved white dotted line to the right of the vertical red line is a simulated/theoretical parcel of air that is lifted into the atmosphere. The parcel is a theoretical concept.. just think of rising air and the temperature of that air as it rises. In order to get a cloud, you need moist air to rise and condense, so you want the parcel to be warmer than the environmental air surrounding it. The gap between the red line (environmental temperature) and the white curved line (theoretical parcel temperature) is called CAPE, which you've probably seen depicted on maps. SBCAPE means that the theoretical parcel originated at the surface. The more cape you have, the more a parcel of air will continue to lift in the atmosphere. In fact, as long as there is a gap between the red line (environmental temperature) and white line (theoretical parcel), the parcel will continue to rise in the atmosphere on it's own, all the way until those lines meet which is called the equilibrium level. The white numbers on the vertical/Y axis, on the left side, are pressure levels (1000 = 1000mb, 850 = 850mb,, etc).. The larger the overall gap between the red line and white line, the more CAPE you have. In the sounding in the picture, the cape region is nice and fat, and if you look below you'll see that surface-based CAPE is over 3000, indicating a very unstable atmosphere! You also typically want the red line to be more tilted/more sloped as that would indicate faster cooling with altitude (this is called steep lapse rates) which can help with instability. There are some other things on this panel which aren't that important for a basic understanding or application. The wind barbs on the right side of the panel indicate wind speed/direction at each vertical level depicted. Now, on the top right there is another panel that looks like a + with circles around it and a multi-colored squiggly line. This is called a hodograph. The hodograph is a depiction of wind speed and direction at each vertical level, mapped as a line. Each vertical point is plotted on the hodograph as a vector. Vector may sound scary but they're very simple. The farther away the point is from the center, the stronger the wind speed is at that level.. and the arrow (on the picture below) is pointed in the direction that the wind is blowing at that level. The hodograph on the sounding doesn't have the arrows, just a line connecting the points at the end of those arrows. Hodographs are helpful in depicting wind shear and helicity. The "fatter" or wider the hodograph line, the more wind shear or helicity you probably have. If the line is rather straight and short, you may not have much shear. If the line is big and curved, you likely have strong wind shear and helicity (which are different btw). In the sounding I put up above, the wind shear and helicity are very strong and it is characterized by a big curved hodograph line. See the red line on the hodograph is large and curved. The "storm slinky" below the hodograph isn't too important IMO, I don't use it much. It essentially combines the theoretical air parcel (or updraft) with the wind profile to depict a theoretical updraft "shape". You typically want it to be curved or kidney-bean shaped, like the one in the sounding above is.
hodo.jpg

The Psbl Haz Type is over-used and is simply a combination of parameters, I advice against using it. I know seeing "PDS TOR" can be exciting, but it doesn't mean much other than that some parameters are high. The parameters at the bottom of the sounding are all derived from the thermodynamic (temperature/moisture/skew-t panel top left) and hodograph wind profile. CAPE is instability, gap between the raised parcel and environmental temperature, as explained earlier. CINH is the opposite of cape, it's when the red line (temperature) is on the right side of the theoretical parcel temperature, indicating that the environmnetal temperature is warmer than the parcel.. this would cause the parcel to sink instead of rise. LCL Is the level at which the humidity is close to 100%, typically where a cloud would begin to form (so the cloud's base height in meters). LI is lifted index, another measure of instability similar to cape (lower is better for LI). LFC Is level of free convection, it's the level at which a parcel can freely rise without needing any other catalyst pushing it up. EL is equilibrium level, where the parcel temp and environmental temp are equal, in meters. For naders, you want LFC and LCL to be low. (LCL below 1200m, LFC below 2400m). To the right are wind-based parameters. SRH Is storm relative helicity, which is essentially how much spin a parcel has before it's lifted into a storm.. a bit of a complicated parameter, but can be helpful in determining tornado threat, especially low level SRH and especially VERY low level SRH (such as from the surface to 100m or 500m!) You want a spinning updraft, and with enough SRH you get that. You typically want >100 0-100m SRH, >200 0-1km SRH, >300 0-3km SRH). On the sounding above, the SRH is extremely high at all levels, indicating a great tornado threat. Shear is the change in wind speed and direction with height, measured in kts by a vector difference equation. the analog system isn't that helpful, but it lists events of supercells and hail which had "similar" looking soundings.


I know this is a lot, if you have any questions about any of that, feel free to ask. I know it can be confusing at first, but it's all pretty basic stuff. Remember, severe storm and tornado forecasting involves MUCH more than just looking at forecast soundings. In fact, nowadays I don't look at soundings that much outside of tornado research.
 
Some pretty aggressive wording in GSPs morning AFD

LONG TERM /FRIDAY THROUGH MONDAY/...
As of 318 AM EST Tuesday: As a compact upper low over the ArkLaTex
region lifts northeast into southern Illinois on Friday morning,
global models remain in excellent agreement on the evolution of
a potentially-impactful frontal system arriving from the west.
By this point in time, most of the Carolinas will be solidly locked
into a potent WAA regime, and this will only strengthen throughout
the day as a screaming LLJ shifts east of the mountains by early
afternoon. We`ll be tapping into deep warm sector air at this
point, and low-level convergence suggests the main rainband arriving
between 18z and 21z, an ideal mid-afternoon timing for convective
development...allowing sbCAPE to soar to values of 700-1000 J/kg
across the Upstate, and lower but still impressive values in the
Piedmont. All three global models depict an easy 40-50kts of deep
layer shear overlapping the most unstable areas...with generally
unidirectional hodographs supportive of QLCS-mode convection with
the main frontal band. Model soundings indicate a dry layer aloft
suggesting the potential for damaging winds...and shear values
alone support embedded rotation.

There remains much uncertainty in how this system will play out.
We won`t be able to say much for certain until Wednesday evening,
when HREF ensembles will reach out far enough for a more detailed
analysis. That being said...there`s been excellent run-to-run
consistency over the last 36 hours between the GFS, ECMWF,
and increasingly the CMC as well, and clustering suggests that
none of these models are outliers in their respective ensembles.
All this warrants improving confidence that a meaningful severe
threat will be in play on Friday afternoon.
 
At this stage it seems like Georgia will be Friday’s main event, some timing discrepancies among the globals makes it more uncertain as you go eastward from GA
 
Is there a source to learn how to read these? I don’t know how to do that yet but want to learn


Continued discussion should probably go in this thread since it's asking basically the same thing:
 
Outside of severe weather MHX mentions strong winds for Friday ahead of the low. What are some of the model gusts outputs?
 
Back
Top