Man that look next week on the GFS is just about textbook for central Alabama. Sure would like to see it trend upwards
-
Hello, please take a minute to check out our awesome content, contributed by the wonderful members of our community. We hope you'll add your own thoughts and opinions by making a free account!
You are using an out of date browser. It may not display this or other websites correctly.
You should upgrade or use an alternative browser.
You should upgrade or use an alternative browser.
Pattern January 2020 - Operation Thaw Alaska
- Thread starter KyloG
- Start date
tennessee storm
Member
If only we had a good source of true cold air... mehMan that look next week on the GFS is just about textbook for central Alabama. Sure would like to see it trend upwards
Man that look next week on the GFS is just about textbook for central Alabama. Sure would like to see it trend upwards
You could always rent a cabin or hotel room on Mt. Cheaha. They might be able to gets some flakes out of it...
Atlanta is not even forecast to go below 32 the next 14 days ! I guess the cold air next week disappeared.
packfan98
Moderator
Please stop trolling. If you can look at the forecast for Atlanta, you can look at the models. We discuss them everyday.Atlanta is not even forecast to go below 32 the next 14 days ! I guess the cold air next week disappeared.
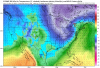
No ensemble support this run unfortunatelyView attachment 29363
Not that this will happen but at least there is potential. This still needs work, we need a nice northeast high with a well timed s/w to have a chance.
John1122
Member
Atlanta is not even forecast to go below 32 the next 14 days ! I guess the cold air next week disappeared.
The Euro has it below multiple times, as soon as the next 5 days, has a low of 21 in Atlanta next week. Will see if that continues this run.
Meh... maybe the Euro throws us a bone today. Isn't that how it works, one model loses it then the other picks it up and so forth and so on... ")

However, Tn folks still looking good for a flizzard
tennessee storm
Member
Not sure i f he is really trolling pack... cause the 12z gfs only has Memphis down to below freezing one time in the next 10 days up coming ... and that’s at 31.... just sayingPlease stop trolling. If you can look at the forecast for Atlanta, you can look at the models. We discuss them everyday.
Its trolling when other models have it below freezing and instead of looking you make a broad brush incorrect statementNot sure i f he is really trolling pack... cause the 12z gfs only has Memphis down to below freezing one time in the next 10 days up coming ... and that’s at 31.... just saying
Sent from my SM-G975U using Tapatalk
packfan98
Moderator
I understand. However, after 3 years and 5,000 posts here, someone knows whether the cold air disappeared or not. At the very least, it should be in the Whamby thread.Not sure i f he is really trolling pack... cause the 12z gfs only has Memphis down to below freezing one time in the next 10 days up coming ... and that’s at 31.... just saying
Webberweather53
Meteorologist
Clearly the best chance for snow will be in the mountains, TN, and perhaps northern AL and GA but I don’t think the lack of snowfall output (which is based on p type algorithms that will struggle in a setup like this) on the GEFS or EPS members in SC or NC means that we can’t see some rain/snow showers this weekend. I think some scattered rain/snow showers are legitimately possible given the potential intensity of this upper trough and how shallow the melting layer will be near the surface even in parts of the Carolinas, despite the apparent lack of NWP support on p type algorithms & snow output.Meh... maybe the Euro throws us a bone today. Isn't that how it works, one model loses it then the other picks it up and so forth and so on...
View attachment 29366
Storm5
Member
Euro has some light snow for Kentucky this weekend
Sent from my iPhone using Tapatalk
Sent from my iPhone using Tapatalk
That’s the only news I needed to hear today ?Euro has some light snow for Kentucky this weekend
Sent from my iPhone using Tapatalk
Hold on to your skivvies.....

NBAcentel
Member
Looks Convective aswell with steep lapse rates and weak instability , which will probably aid in heavier rates which cools the BLClearly the best chance for snow will be in the mountains, TN, and perhaps northern AL and GA but I don’t think the lack of snowfall output (which is based on p type algorithms that will struggle in a setup like this) on the GEFS or EPS members in SC or NC means that we can’t see some rain/snow showers this weekend. I think some scattered rain/snow showers are legitimately possible given the potential intensity of this upper trough and how shallow the melting layer will be near the surface even in parts of the Carolinas, despite the apparent lack of NWP support on p type algorithms & snow output.
Last edited:
This probably should have gone in banter, don't get too excited, it's just anafront potential.... sorry y'all know how that works out 99.9% of the time.
Eh .. peak climo could help us out hereThis probably should have gone in banter, don't get too excited, it's just anafront potential.... sorry y'all know how that works out 99.9% of the time.


John1122
Member
Last run of the CFS for Jan. Would be pretty remarkable to finish Jan with neutral temps considering the first half looks solidly AN.
View attachment 29381View attachment 29382
This is quite closely mirroring the events of 1954-1955. The fall and winter season have been remarkably similar. Record highs set and broken on the same days at times. Hot Octobers, cold Novembers, December that saw temps start cold and go AN. 70+ degree highs on Dec 30th both years. Jan 1955 started out well AN through the first 10 days but finished up BN with a cold run in the second half.
cd2play
Member
Going by the climate archive, January & February 1955 did offer one or two decent snows.This is quite closely mirroring the events of 1954-1955. The fall and winter season have been remarkably similar. Record highs set and broken on the same days at times. Hot Octobers, cold Novembers, December that saw temps start cold and go AN. 70+ degree highs on Dec 30th both years. Jan 1955 started out well AN through the first 10 days but finished up BN with a cold run in the second half.
Nerman
Member
John1122
Member
Going by the climate archive, January & February 1955 did offer one or two decent snows.
Early January 1955 even had some 70 degree weather before taking a turn. Nice I-40 corridor snow event from Nashville to Raleigh around January 18th-20th 1955 that year.
Still a good way out and can trend south or north so definitely some potential here .. Gfs further south solution and euro is a cutter but very strong possible Annafront situationThis could hopefully produce some winter weather.
John1122
Member
Still a good way out and can trend south or north so definitely some potential here .. Gfs further south solution and euro is a cutter but very strong possible Annafront situation
Anafrontal worked pretty well for some West of the mountains in December. Northern Alabama had it's first 1+ inch snow in a few years. 3-4 inches fell in my area on the Northern Cumberland Plateau. Around 1.5-2 over a lot of the eastern half of Tennessee, especially 40 and north. Anafrontal rain to snow events used to be common it seemed but that was the first one here in probably 10 years. Granted in the 1970s every form or way of getting snow was more common.
Last edited:
Webberweather53
Meteorologist
EPS support for Jan 7-9 took a big hit on the most recent 12z suite.
GraphicEPS support for Jan 7-9 took a big hit on the most recent 12z suite.


Well it’s often said that the only CFS run that matters is the last day of the month and this one continued its trend the last few days of being closer to average in the southeast. With it looking like above to well above average being likely for the first two and half weeks minus next week’s short cold shot, you have to wonder if the model is seeing a sharp pattern change around the 18th or 20th. As others have said, with the cold buildup going in Canada, he once the indicies get where we need them, a colder pattern should come quickerThis is quite closely mirroring the events of 1954-1955. The fall and winter season have been remarkably similar. Record highs set and broken on the same days at times. Hot Octobers, cold Novembers, December that saw temps start cold and go AN. 70+ degree highs on Dec 30th both years. Jan 1955 started out well AN through the first 10 days but finished up BN with a cold run in the second half.
Well out of sheer boredom I looked at all the Januarys since the mid 70's where the MJO had high amplitude (>1) into ph4 or 5. You get this graphic below, which isn't surprising as its what the ensembles are all showing through mid-January.


I then looked at the ones that had AN temps in the E/SE and of course those carried on with a similar pattern.

But, exactly half of them did have BN temps in the E/SE for Feb...graphic below. So I guess the point of this post was that this pattern in January isn't a death knell for rest of winter. Question is what was the reason for the BN Feb analogs v/s the AN analogs...


I then looked at the ones that had AN temps in the E/SE and of course those carried on with a similar pattern.
But, exactly half of them did have BN temps in the E/SE for Feb...graphic below. So I guess the point of this post was that this pattern in January isn't a death knell for rest of winter. Question is what was the reason for the BN Feb analogs v/s the AN analogs...
Jon
Member
Last run of the CFS for Jan. Would be pretty remarkable to finish Jan with neutral temps considering the first half looks solidly AN.
View attachment 29381View attachment 29382
Technically this is the last run (so far, I think there’s an 18z run)


The CPC site of the first image is actually averaged from Jan 28-31, but you’re not wrong that’s the last one they post!
Sent from my iPhone using Tapatalk

D
Deleted member 609
Guest
Icon looks interesting tooView attachment 29410
Still interested in this time frame. A little more energy at the base of this trough and a low could pop
Nomanslandva
Member
Yea, 12 Z CMC and Euro were cutters and now ICON and GFS are suppressed. Will be curious to see where this goes.View attachment 29410
Still interested in this time frame. A little more energy at the base of this trough and a low could pop
John1122
Member
Who knows where it will go, but the GFS looks better at 500 by 192-204. -EPO starting to touch western Canada, building a -AO and pushing the PV towards Northern Canada.
Here is a comparison of the two at H5. The Icon imo looks much better. If we were to speed up that northern stream, we would really be cooking. Although that blocking in SE Canada is going prevent that a bit.


Not sure where to post this, but,
HAPPY NEW YEAR!!
2020!
The beginning of a brand new decade for weather and new challenges
Edit: I didn’t see the new thread. Could someone move this over there?
HAPPY NEW YEAR!!
2020!
The beginning of a brand new decade for weather and new challenges
Edit: I didn’t see the new thread. Could someone move this over there?
Last edited:
RollTide18
Member

This could've been a nice flizzard for Alabama.
John1122
Member
Pretty big flip at 500mb over the Arctic on the GFS vs last night, but similar result with the big trough in the west. Just looks like a -AO/-PNA instead of a +AO/-PNA. It's sad. If we could get that giant EPO ridge to set up 600-800 miles east and orient north to south we would be having epic winter weather. Looks like it tries before 216 but it retrograde West and allows then big -PNA to develop downstream.
Canada is absolutely filled, coast to coast with super cold air. Just need a way to dislodge it and hold it here rather than glancing blows.
Canada is absolutely filled, coast to coast with super cold air. Just need a way to dislodge it and hold it here rather than glancing blows.
Looking at the GEFS I’m seeing a few more interesting members for the 7-8th event