• Hello, please take a minute to check out our awesome content, contributed by the wonderful members of our community. We hope you'll add your own thoughts and opinions by making a free account!

Wintry Winter 26-27

I think Mother Nature throws us a little curveball to start winter and December this year will probably look more like your typical big Nino January than a big Nino December.

Not exactly cold by any means (& arguably not cold enough to really snow outside the mtns) but probably will end up much more seasonable than we’ve been accustomed to seeing in other recent big Nino events like 2015.
I think we might squeak by in Northeast Tennessee during that period by what I’m seeing. Any chances of a December 09 style event?
 
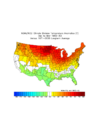
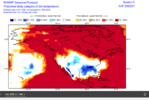
Based strictly on the combo of an E based super Nino with +QBO, 1982-3 is the single best analog for DJFM. Although it was AN in the megapolis, this was no torch there with it only ~2F AN. The true torch was much further W centered on the upper MW. The S US was NN (1877-8 among others was similar):
IMG_3282.png

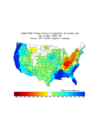
Precip: sharp deliniation between very wet SE/AN NE coast to BN to the NW and AN beyond that
IMG_3283.png
 
I think we might squeak by in Northeast Tennessee during that period by what I’m seeing. Any chances of a December 09 style event?

I’m not confident in one occurring that early in winter because of the lack of cold air. As the Pacific Jet progressively shifts equatorward in Jan-Feb and we see more hits on the polar vortex, I think if we get a big dog event, it occurs in that portion of the winter (Jan-Feb).

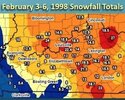
You definitely can get/have had big dogs in super Ninos in NE TN. Take early Feb 1998 as an example

IMG_9288.jpeg
 
I’m not confident in one occurring that early in winter because of the lack of cold air. As the Pacific Jet progressively shifts equatorward in Jan-Feb and we see more hits on the polar vortex, I think if we get a big dog event, it occurs in that portion of the winter (Jan-Feb).

You definitely can get/have had big dogs in super Ninos in NE TN. Take early Feb 1998 as an example

View attachment 199291
Oh yeah people talk about that one almost as much as 93
 
Lots of nice, dry weather this month. Kind of wild we’ve had, or will have no 30s anytime soon.
 
Agree SD. AAM momentum surge into the subtropics / momentum sink in high latitudes during mid-late Nov. That combines with downward drip of the strat weakening / SSW - leads to -AO/-NAO blocking later Nov / early Dec with Pac jet stream dropping south - wetter along California into the SE, cooler temps
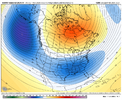
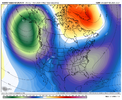
Surely this is a safe zone for posting a little long range fun on occasion (Dec 8-10)

IMG_5594.png

IMG_5595.png
 
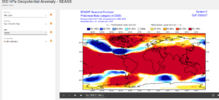
The 30 hPa QBO per ATMO Hub dropped from +17.6 in Sept to +14.0 in Oct. But I advise folks to not take that small drop and interpret that to mean that a -QBO is going to arrive by Feb (though I expect some x weenies to do just that….be prepared :rolleyes:). All it is doing is oscillating within the solidly positive region (the image below shows this well).

Related to that, 20 hPa and 15 hPa are still maintaining their strong status with +17.5 to +17.6. Also, the level that Paul Roundy referred to a few days ago, 70 hPa, as expected rose sharply from +2.6 to +7.0.

The last 29 +cycles at 30 hPa have lasted 10 months++ and have averaged ~13 months going back to 1960. The current one started in May. Feb ‘27 would be the 10th month and May ‘27 the 13th month.

Thus, I maintain my prediction that there will be a +QBO at 30 hPa through at least Feb with Feb likely lower than the current +14 but likely still at +5+ and possibly as high as ~+10. My best guess as to when it goes to a -QBO is still around May. Thus, 2015-6, 1982-3, and 1957-8 remain the top +QBO/strong+ Nino analogs ignoring where it will be based (east). If the E basedness is then incorporated, 1982-3 easily becomes the best overall analog.

This image (just updated for Oct) better illustrates the current QBO status at all levels. As one can clearly see, we’re in the heart of a solid +QBO at 30 hPa that won’t end per history til at the very least 3 months after we see it first dropping to <0 at 10 hPa. The avg lag of going to -QBO from the 10 hPa level to the 30 hPa level is actually 7 months:

I read a paper about the QBO and winter effects a couple of years ago, and it noted that the direction of the QBO mattered more than the absolute reading. It found that a negative QBO that was rising towards positive leaned less towards less blocking than a positive QBO that was falling.

I can't remember where I found it now but thought that was interesting.
 
I read a paper about the QBO and winter effects a couple of years ago, and it noted that the direction of the QBO mattered more than the absolute reading. It found that a negative QBO that was rising towards positive leaned less towards less blocking than a positive QBO that was falling.

I can't remember where I found it now but thought that was interesting.

Interesting. Thanks for posting that. Regardless, 2026-7 QBO looks similar to 2015-6, 1982-3, and 1957-8. These 3 were similarly moving toward the tale end of a +QBO phase.
 
Last edited:
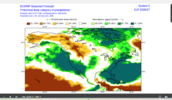
Surely this is a safe zone for posting a little long range fun on occasion (Dec 8-10)

View attachment 199312

View attachment 199314
Couple thoughts about this, fantasy tho it may be.

Nearly every year we get snow in the December 8th-12th window here in NE TN. Everything from flurries to 14”. Mother Nature just likes those dates.

Also, I like that this upper map is telling us that if we have a somewhat crappy EPO, but the PNA is still positive and Atlantic is primed we at least have a shot.

IMO for example, the December 2018 storm was something magnificent that we pulled out of a very mediocre pattern.
 
Couple thoughts about this, fantasy tho it may be.

Nearly every year we get snow in the December 8th-12th window here in NE TN. Everything from flurries to 14”. Mother Nature just likes those dates.

Also, I like that this upper map is telling us that if we have a somewhat crappy EPO, but the PNA is still positive and Atlantic is primed we at least have a shot.

IMO for example, the December 2018 storm was something magnificent that we pulled out of a very mediocre pattern.
I thought this pattern sounded interesting so I gathered some ECMWF ERA5 & Conus NCAR data for the timeframes from the past years and here is a list:

12/08/20251793801965405.png
12/11/2024
1793802289425.png
12/10/2023 (elevation dependent)
1793802362518.png
Didn't see anything for 2021 or 2022

12/07/2020 (E TN Flurries)
1793802933774.png
12/11/2019
1793803053377.png
12/09/2018 (Diego)
1793803124257.png
12/09/2017 (Benji)
1793803206129.png
Don't see anything for 2015 or 2016
12/10/2014 (NE TN Flurries)
1793803500597.png
12/10/13 (Mixed Precip/ZR)
1793803761342.png
Not seeing anything for 2011 or 2012

12/13/2010
1793804003908.png
And there was a ZR event on Dec 12-13, 2009, but mostly for traditional CAD regions E of the mountains into NC.

Too early to even look at these extended outlooks for what they show during this timeframe, but the pattern over the past several years supports the idea of more likely than not to produce winter weather in that timeframe for the general area, so it's nice to see the extended range Euro hinting at the idea.
 
d70649cd41519e1e36633c27e12289ff.jpg

I don’t know where else to post this, but glad to see that upper air data soundings are beginning again out west.


Sent from my iPhone using Tapatalk
 
d70649cd41519e1e36633c27e12289ff.jpg

I don’t know where else to post this, but glad to see that upper air data soundings are beginning again out west.


Sent from my iPhone using Tapatalk
For awhile they only did 18z but finally some changes have occurred behind the scenes to have 12z and 00z. Went into affect not too long ago. The service is returning to what it was pre-DOGE.
 
For awhile they only did 18z but finally some changes have occurred behind the scenes to have 12z and 00z. Went into affect not too long ago. The service is returning to what it was pre-DOGE.
Also I can’t expand too much on this at this moment, but amazing improvements coming soon to the NWS website. Beta is already being tested for it.
 
Also I can’t expand too much on this at this moment, but amazing improvements coming soon to the NWS website. Beta is already being tested for it.
How long has the NWS website had the same visual layout? I don't even remember what it looked like before now. (BTW that's a rhetorical question)

I assume some optimization for mobile browsers at least.
 
Big golf front. Think he meant cold front lol. I am wondering if its SSW attributed or mjo progression?

I don’t see how it is related to the SSW since should it lead to cold, that wouldn’t be til early Dec at the earliest per a minimum 30 day lag for a very early SSW StormchaserChuck. MJO is headed toward MC mid-Nov. So, I see no connection there. Maybe it is just the super El Niño because it correlates decently to a +PNA dominating and a strong +PNA is progged to continue through then.
 
Been a long time since Ive seen a sexier looking Blocking H5 map that runs from 11/23-12/7 on the latest cfs map. And it delivers the goods at the surface as one would expect. See if this theme can continue. eye catching when the control run and cfs kind of barking same cadence.
 
What’s not to love about the new Euro winter outlook if you’re hoping for a colder than normal winter in the Conus?

-For the CONUS as a whole and especially from Chicago-NYC south, it has by far the lowest H5 of any Nov forecast for winter of any of the last 10 years! It has the darkest of the 4 blues over a good portion of the E US . The prior 9 didn’t even have any of the Conus in the 2nd shade of blue anywhere!

-As an added bonus, H5 is slightly lower than what last month had.

-Furthermore, ever since the first DJF 26-7 forecast was available, it has been very consistent (4 months in a row) and the most consistent worldwide of any of the last 10 years.

-To add to that, the -NAO keeps getting stronger as we get closer (blue over Azores has been getting darker) and is by far the strongest -NAO of any of the 10 Nov forecasts with only 25-26 having a notable -NAO (which didn’t verify far off by the way). Other than 25-6, 26-7 is the only year with a strengthening -NAO for winter as it has gotten closer! Related to that, the heights in E Canada are the highest of any of the last 10 years.

————————

Here’s a comparison of the DJF maps for the last 10 years of 11/1 forecasts for winter showing how much lower H5 is for the Conus as a whole by far including 23-4:

26-7: by far the lowest Conus H5 and strongest -NAO of these last 10
IMG_3351.png

25-6: only other one having any -NAO of note and it still is much weaker than that of 26-7
IMG_3353.png

24-5:
IMG_3354.png

23-4 (El Nino): not even close to 26-7
IMG_3355.png

22-3:
IMG_3356.png

21-2:
IMG_3357.png

20-1:
IMG_3358.png

19-20:
IMG_3359.png

18-9: El Nino (not even close to 26-7)
IMG_3360.png

17-8:
IMG_3361.png
 
Last edited:
What’s not to love about the new Euro winter outlook if you’re hoping for a colder than normal winter in the Conus?

-For the CONUS as a whole and especially from Chicago-NYC south, it has by far the lowest H5 of any Nov forecast for winter of any of the last 10 years! It has the darkest of the 4 blues over a good portion of the E US . The prior 9 didn’t even have any of the Conus in the 2nd shade of blue anywhere!

-As an added bonus, H5 is slightly lower than what last month had.

-Furthermore, ever since the first DJF 26-7 forecast was available, it has been very consistent (4 months in a row) and the most consistent worldwide of any of the last 10 years.

-To add to that, the -NAO keeps getting stronger as we get closer (blue over Azores has been getting darker) and is by far the strongest -NAO of any of the 10 Nov forecasts with only 25-26 having a notable -NAO (which didn’t verify far off by the way). Other than 25-6, 26-7 is the only year with a strengthening -NAO for winter as it has gotten closer! Related to that, the heights in E Canada are the highest of any of the last 10 years.

————————

Here’s a comparison of the DJF maps for the last 10 years of 11/1 forecasts for winter showing how much lower H5 is for the Conus as a whole by far including 23-4:

26-7: by far the lowest Conus H5 and strongest -NAO of these last 10
View attachment 199373

25-6: only other one having any -NAO of note and it still is much weaker than that of 26-7
View attachment 199374

24-5:
View attachment 199375

23-4 (El Nino): not even close to 26-7
View attachment 199376

22-3:
View attachment 199377

21-2:
View attachment 199378

20-1:
View attachment 199379

19-20:
View attachment 199380

18-9: El Nino (not even close to 26-7)
View attachment 199381

17-8:
View attachment 199382
Do you have the temperature anomaly maps too?

Also, I've noticed the end of the ensembles are nuking the persistent Gulf of Alaska vortex near the end of thier runs over the past couple of days. Change is in the air.
 
Do you have the temperature anomaly maps too?

Also, I've noticed the end of the ensembles are nuking the persistent Gulf of Alaska vortex near the end of thier runs over the past couple of days. Change is in the air.

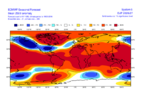
Here’s 2m, the coldest of any of the last 10 winters issued in Nov in the S half of the US, as none of the other 9 had any shade of blue anywhere in the Conus essentially:
IMG_3329.png
 
Last edited:
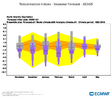
Today’s November release of the Euro Seasonal (SEAS5) is forecasting an overall -NAO winter per the model median value, strongest in February.

Purple is the Euro Seasonal forecast (in box and whisker format with black line the median)

Gray is model climatology. Orange is hindcast of the analysis distribution

20261105102402-eac5fc5c819ebd48be2fa6a536046fab70df1b4a.png


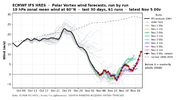
In the near term, we are closing in on an official SSW, but similar to last November, this one is going to be a close call.

Nov 5 SSW Euro.png


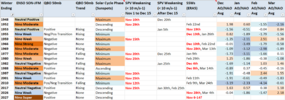
But here are all years since 1940 in which a strong SPV weakening (10mb zonal winds <10 m/s-1) or an official SSW occurred from Nov 1 to Dec 15, with an AO/NAO averaged index shown for the winter months (Dec-Mar). Source for SPV data: https://simonleewx.com/10-hpa-60n-zonal-mean-zonal-winds/

Early SPV Weakening Years.png


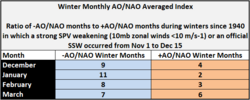
For those winters, here are the ratios of -AO/NAO months vs +AO/NAO months

Early SPV Weakening Years AO NAO.png


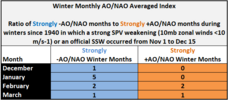
Same chart but for ratio of only Strongly -AO/NAO months to Strongly +AO/NAO months

Early SPV Weakening Years AO NAO Strong.png


Bottom Line: The November release of the Euro Seasonal is forecasting a -NAO thru the winter, maximized in February. Past occurrences of a weak SPV in early winter (Nov 1 to Dec 15) have favored the development of -AO/-NAO blocking patterns during the winter months of December, January, and February, with a particular emphasis on the month of January.
 
Back
Top