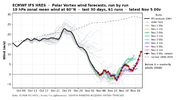
The 30 hPa QBO per ATMO Hub dropped from +17.6 in Sept to +14.0 in Oct. But I advise folks to not take that small drop and interpret that to mean that a -QBO is going to arrive by Feb (though I expect some x weenies to do just that….be prepared

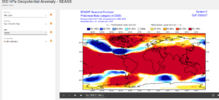
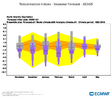
). All it is doing is oscillating within the solidly positive region (the image below shows this well).
Related to that, 20 hPa and 15 hPa are still maintaining their strong status with +17.5 to +17.6. Also, the level that Paul Roundy referred to a few days ago, 70 hPa, as expected rose sharply from +2.6 to +7.0.
The last 29 +cycles at 30 hPa have lasted 10 months++ and have averaged ~13 months going back to 1960. The current one started in May. Feb ‘27 would be the 10th month and May ‘27 the 13th month.
Thus, I maintain my prediction that there will be a +QBO at 30 hPa through at least Feb with Feb likely lower than the current +14 but likely still at +5+ and possibly as high as ~+10. My best guess as to when it goes to a -QBO is still around May.
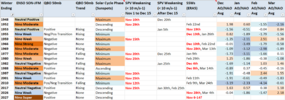
Thus, 2015-6, 1982-3, and 1957-8 remain the top +QBO/strong+ Nino analogs ignoring where it will be based (east). If the E basedness is then incorporated, 1982-3 easily becomes the best overall analog.
This image (just updated for Oct) better illustrates the current QBO status at all levels. As one can clearly see, we’re in the heart of a solid +QBO at 30 hPa that won’t end per history til at the very least 3 months after we see it first dropping to <0 at 10 hPa. The avg lag of going to -QBO from the 10 hPa level to the 30 hPa level is actually 7 months: