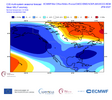
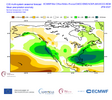
These models will soon correct there selves when it picks up on the super Nino as we move closer to winter .
My point wasn’t at all to say that the CFS is too cold (or too warm). Obviously nobody knows how the CFS will do. Rather, my point is that the WB CFS maps don’t accurately represent the actual CFS output due to algo issues. For accurate CFS output, go to the CFS site here:
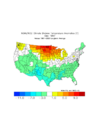
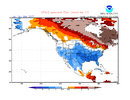
From the link above, here’s the latest REAL 10 day avg of JFM: keep in mind that this is vs 1991-2020 climo (I’ll address that later):
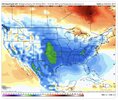
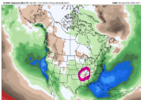
Now here’s the faulty algo ridden WB 10 day for the same period: keep in mind that this is vs 1981-2010 climo (I’ll address that later):
 Observations:
1. The real CFS output doesn’t have that ever-present WB CFS cold spot over S Lake Michigan.
2. The real CFS output doesn’t have that ever-present WB CFS thin warm area along the E coast Mid-Atlantic to SE states.
3. The WB CFS output is significantly colder than the real CFS output for most of the E US away from the E coast and for the C US. Note how much further N the blues go on WB!
Examples:
-Chicago: WB CFS has them at -2C using 1981-2010 vs the real CFS’ 0C using 1991-2020. That means WB CFS output is ~4.5F too warm vs the real CFS output. Keep in mind that 1991-2020 is ~1F warmer than 1981-2010 and thus is incorporated in my analysis.
-St. Louis: WB CFS: -3C (1981-2010) vs real CFS’ ~-1C (1991-2020). So, WB is again ~4.5F too warm.
-Tulsa: WB CFS: -4C (1981-2010) vs real CFS’ of an estimate via interpolation of -2.2C (1991-2020). So, WB is ~4F too warm.
-ATL: WB CFS: ~-3.5C (1981-2010) vs real CFS’ est via interp. of -2.3C (91-20). So, WB is ~3F too warm.
-RDU: WB CFS: ~-1.2C (81-10) vs real CFS’ -2.3C (91-20). So, WB is ~3F too warm.
Now, as I said, WB has a thin warm area along/near much of the E coast. That actually causes some of that area to be correct on WB.
-SAV and JAX: WB CFS: -1.5C (81-10) vs real CFS’ -2C (91-20). So, WB is actually correct.





















 ️
️