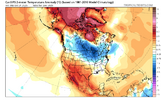
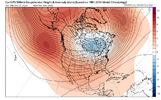
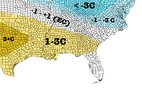
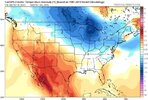
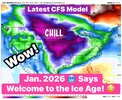
A front loaded winter is better than no winter which is normally what we have.Eric, i think it would be safe to say that it will probably be a front loaded winter, and IF they spv or tpv are weaker than normal then winter may extend past December but it's only speculation since I'm not a meteorologist
-
Hello, please take a minute to check out our awesome content, contributed by the wonderful members of our community. We hope you'll add your own thoughts and opinions by making a free account!
You are using an out of date browser. It may not display this or other websites correctly.
You should upgrade or use an alternative browser.
You should upgrade or use an alternative browser.
Wintry Winter 25-26 Winter Battle Zone
- Thread starter SD
- Start date
MRKEVIN7575
Member
If the ---IOD is not good for cold weather in winter then we should hope and pray it rises as winter draws closer
NBAcentel
Member
The -IOD actually encourages the early/front loaded theme as wellIf the ---IOD is not good for cold weather in winter then we should hope and pray it rises as winter draws closer
Webberweather53
Meteorologist
Inspired by the study @griteater shared with us a few days ago, I replicated their QBO/Solar analysis on subseasonal variability of the polar vortex, but used a lot more data, looked only at cool neutral and La Niña winters, and utilized NOAA 20th Century Reanalysis SLP to analyze surface variability in the polar vortex.
In order to increase the sample size of the data I had to play with, I also used this pre-1953 QBO reconstruction from Bronnimann et al (2007) to analyze early 20th century QBO behavior.
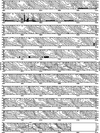
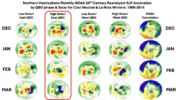
Breaking down things by month revealed some very interesting behavior. I highlighted this year's current solar/QBO combo (High solar/East QBO) for reference (Warm colors = High SLP, Cold Colors = Low SLP). There's of course a lot of variability still within each sub-composite, but it was neat to see what this looked like anyway.
High Solar/East QBO/-ENSO winters like this one historically tend to have a weaker polar vortex & -NAO in December and January, and usually see a rather sudden & dramatic flip of the AO/NAO to positive (or even strongly positive) during February, with the positive AO/NAO lasting into at least March.
One thing you can honestly say about High Solar/East QBO winters like this year compared to other cool ENSO cases is that outside of January, they tend to follow the typical La Niña paradigm (far right column) more than most. (i.e. a front-loaded winter).
In order to increase the sample size of the data I had to play with, I also used this pre-1953 QBO reconstruction from Bronnimann et al (2007) to analyze early 20th century QBO behavior.

Breaking down things by month revealed some very interesting behavior. I highlighted this year's current solar/QBO combo (High solar/East QBO) for reference (Warm colors = High SLP, Cold Colors = Low SLP). There's of course a lot of variability still within each sub-composite, but it was neat to see what this looked like anyway.
High Solar/East QBO/-ENSO winters like this one historically tend to have a weaker polar vortex & -NAO in December and January, and usually see a rather sudden & dramatic flip of the AO/NAO to positive (or even strongly positive) during February, with the positive AO/NAO lasting into at least March.
One thing you can honestly say about High Solar/East QBO winters like this year compared to other cool ENSO cases is that outside of January, they tend to follow the typical La Niña paradigm (far right column) more than most. (i.e. a front-loaded winter).

Webberweather53
Meteorologist
It is worth mentioning that this year currently has 2 prominent precursors in place to the development of -EPO/+TNH (or the Asia-Bering sea-N America (ABNA) teleconnection) later this winter as identified by Zhong & Wu (2023).
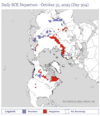
Namely, a warmer-than-normal Maritime Continent & tropical West Pacific, as well as an Eurasian Snow Cover Dipole.
I think it'll be hard to avoid not getting strong, sustained bursts of -EPO/+TNH this winter, despite the easterly QBO favoring a more suppressed Aleutian ridge in the means. I suspect this -EPO/+TNH or ABNA pattern will actually only grow stronger as the winter progresses due to wave reflection from an increasingly strong polar vortex, which is also suggested by my previous post on the QBO & Solar.
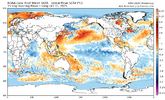
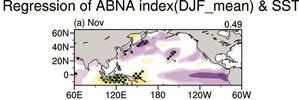
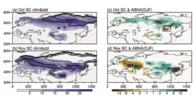
Here's what the "ABNA" pattern typically looks like in winter. It's basically a combination of the East Pacific Oscillation (EPO) & Tropical Northern Hemisphere (TNH) patterns.
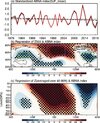
Namely, a warmer-than-normal Maritime Continent & tropical West Pacific, as well as an Eurasian Snow Cover Dipole.
I think it'll be hard to avoid not getting strong, sustained bursts of -EPO/+TNH this winter, despite the easterly QBO favoring a more suppressed Aleutian ridge in the means. I suspect this -EPO/+TNH or ABNA pattern will actually only grow stronger as the winter progresses due to wave reflection from an increasingly strong polar vortex, which is also suggested by my previous post on the QBO & Solar.


Here's what the "ABNA" pattern typically looks like in winter. It's basically a combination of the East Pacific Oscillation (EPO) & Tropical Northern Hemisphere (TNH) patterns.

Webberweather53
Meteorologist
Should we be licking our chops yet?
Webberweather53
Meteorologist
Should we be licking our chops yet?
Can't ask for much more at this range for December.
NC has gone 15 years (2010) without a solidly below average/cold December. This is one of our best opportunities to break that streak.
That was a great DecemberCan't ask for much more at this range for December.
NC has gone 15 years (2010) without a solidly below average/cold December. This is one of our best opportunities to break that streak.
lexxnchloe
Member
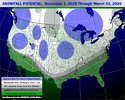
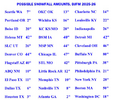
LC winter outlook
lexxnchloe
Member
The map and amount in Charlotte don’t jibe.
Drizzle Snizzle
Member
What is that line that goes through Atlanta ?
Drizzle Snizzle
Member
I think it should probably be 4". Also, 42" in St Louis sounds like a lot for that area. I don't think they average more than 20".The map and amount in Charlotte don’t jibe.
I think it should probably be 4". Also, 42" in St Louis sounds like a lot for that area. I don't think they average more than 20".
3” at Houston??
NBAcentel
Member
This is the dumbest-looking map I've ever seen from a professional forecaster. I'd rather look at DT'S crayon drawing over this slop.
Last edited:
lexxnchloe
Member
Whatever the faults of the map LC is a true gentleman.This is the dumbest-looking map I've ever seen from a professional forecaster. I'd rather look at DT'S crayon drawing over this slop.
Webberweather53
Meteorologist
El Paso hasn’t seen more than 4” of snow in a single storm since 2015. X doubt we get 11” on the season, or more than ABQ for that matter, which is at a much higher elevation
SnowNiner
Member
The map and amount in Charlotte don’t jibe.
Exactly lol. Isolated snow and ice, with the most snow the city would see in 20 years.
I'm not sure why these 1996 paint blob maps are becoming the rage but it's not a good look
Whatever the faults of the map LC is a true gentleman.
Yes, LC has always been a true gentleman and I’ve always appreciated the free very detailed weekly newsletters with a lot of work put into them every week for 20+ years covering wx around the world. Who else does this?
Regardless, nobody’s even near perfect. Unfortunately, his table and map aren’t in sync, which is confusing. Hopefully, he’ll put out a revision to the table.
MRKEVIN7575
Member
I will sing "all my exes wear rolexes" naked live on YouTube if we get 10" in memphis this winter
Last edited:
Snowman63
Member
It happens on occasion, most of the Memphis metro received more than 8" on Jan/10 and another 2.0" on 2/19 this past season.I will sing "all my exes wear rolexes" naked live on YouTube if we get 10" in memphis this winter
MRKEVIN7575
Member
I read LC winter forecast, and he is going against the grain on what most are thinkingIt happens on occasion, most of the Memphis metro received more than 8" on Jan/10 and another 2.0" on 2/19 this past season.
- Joined
- Nov 29, 2021
- Messages
- 42
- Reaction score
- 144
Hey guys, I don’t write on here much and am mostly active on here from late summer-winter as I enjoy tracking winter storms, but here are some of my analogs and forecast maps.
My analog years are (DJF 1951-2010 base year period) 1944, 1946, 1955, 1961, 1962, 1964, 1967, 1970, 1978, 1981, 1995, 2000, 2008, 2010, 2013, 2017, 2020, 2021, 2024.


My analog years are (DJF 1951-2010 base year period) 1944, 1946, 1955, 1961, 1962, 1964, 1967, 1970, 1978, 1981, 1995, 2000, 2008, 2010, 2013, 2017, 2020, 2021, 2024.


- Joined
- Nov 29, 2021
- Messages
- 42
- Reaction score
- 144
December 2025 analog: looking good for the interior southeast and eastern seaboard.


Brent
Member
I read LC winter forecast, and he is going against the grain on what most are thinking
Isnt he usually kind of optimistic
I mean I think nobody has a clue personally. Last year proved we can get our average snow in one storm but beyond that... Or expecting some big historic winter... I'm not holding my breath. We do still live in the south after all
Isnt he usually kind of optimistic

I mean I think nobody has a clue personally. Last year proved we can get our average snow in one storm but beyond that... Or expecting some big historic winter... I'm not holding my breath. We do still live in the south after all
It’s looking good for you, Kevin, Mack, the guy who moved from ATL? to Chicago, the guy who moved to Maine, and the MT poster per LC’s map! Sorry if I missed others.
Brent
Member
It’s looking good for you, Kevin, Mack, the guy who loved from ATL? to Chicago, the guy who loved to Maine, and the MT poster per LC’s map! Sorry if I missed others.
if OKC gets 13 inches we may be shut down for awhile
3 inches in Houston???
MRKEVIN7575
Member
Larry, LC and JB know the patterns really well imo but the majority of people like winter, and they know that so they throw out a few bones, if you will, when winter gets closerIt’s looking good for you, Kevin, Mack, the guy who moved from ATL? to Chicago, the guy who moved to Maine, and the MT poster per LC’s map! Sorry if I missed others.
MRKEVIN7575
Member
Not for yall because it's spread out over a seasonif OKC gets 13 inches we may be shut down for awhile
3 inches in Houston???
Brent
Member
Not for yall because it's spread out over a season
Maybe but lately it's been all at once
Even February 2021 which everyone talks about here the whole winter was basically nothing before that. Was near 70 around Christmas
Last edited:
BrickTamland
Member
December to remember!Can't ask for much more at this range for December.
NC has gone 15 years (2010) without a solidly below average/cold December. This is one of our best opportunities to break that streak.
SimeonNC
Member
Honestly, I hope for strong clippers, ULL producing convective snow showers and/or snow breaking containment from the mountains-type set ups. Despite those set ups not producing a lot of snow, I really like them, it makes me feel like I'm living in the north where it can casually snow for a bit.
Plus tracking big systems can be stressful lol
Plus tracking big systems can be stressful lol
Last edited:
As a younger man, I was all about the classical Nino Miller A active southern stream events. As a slightly older man who has been burned so many times by warm noses, slop and sleet (and rain) storms along with getting shafted literally in every cardinal direction, I’ve slowly but surely come to more and more favor the Nina-driven northern stream dominant setups. More widespread, uniform coverage of precipitation and usually no worries about warm noses.Honestly, I hope for strong clippers, ULL producing convective snow showers and/or snow breaking containment from the mountains-type set ups. Despite those set ups not producing a lot of snow, I really like them, it makes me feel like I'm living in the north where it can casually snow for a bit.
Plus tracking big systems can be stressful lol
Swinging for the fences is fun, but batting less than .100 in the last 15 years in those type of setups ain’t.
Welcome to the nina lovers clubAs a younger man, I was all about the classical Nino Miller A active southern stream events. As a slightly older man who has been burned so many times by warm noses, slop and sleet (and rain) storms along with getting shafted literally in every cardinal direction, I’ve slowly but surely come to more and more favor the Nina-driven northern stream dominant setups. More widespread, uniform coverage of precipitation and usually no worries about warm noses.
Swinging for the fences is fun, but batting less than .100 in the last 15 years in those type of setups ain’t.

Welcome to the nina lovers clubView attachment 175927
I’m not in the Niña lovers club, but the last two historic deep SE and/or Gulf coast major winter storms were during La Niña: Jan of 2018 and Jan of 2025 (per RONI), both of which gave me a mix of ZR, sleet, and snow. Locally, the prior measurable winter events back to 1950 were during the following per RONI:
-1/2014 light ZR/sleet: cold neutral
-2/2010 light rain change to snow: El Niño
-2/1996 light snow from upper low: La Niña
-3/1993 light snow backside of superstorm: El Nino
-12/1989 major snow (blizzard): warm neutral
-2/1989 moderate snow: La Niña
-1/1988 moderate ZR: El Nino
-3/1986 moderate snow: cold neutral
-1/1986 light snow: cold neutral
-12/1980 light ZR: warm neutral
-3/1980 light mix: El Niño
-2/1979 light ZR: warm neutral
-1/1977 moderate snow: El Niño
-1/1977 light snow: El Niño
-2/1973 major snow: El Niño
-2/1968 major snow: cold neutral
-2/1958 moderate snow: El Niño
Tally for local measurable wintry events since 1950:
-5 major events: 2 La Niña, 1 cold neutral, 1 warm neutral, 1 El Niño
-5 moderate events: 3 El Niño, 1 cold neutral, 1 La Niña
-9 light events: 4 El Niño, 2 warm neutral, 2 cold neutral, 1 La Niña
-So, total of 19 measurable events locally since 1950 or avg of one every 4 years.
-Out of these 19: 8 El Niño, 4 La Niña, 4 cold neutral, 3 warm neutral
MRKEVIN7575
Member
Is that from snowbird bob?Giddy up! All hail the new king! View attachment 175932

