GSP latest disco mentions possibility of rare blowing snow with the winds and dry snow we are likely to see
-
Hello, please take a minute to check out our awesome content, contributed by the wonderful members of our community. We hope you'll add your own thoughts and opinions by making a free account!
You are using an out of date browser. It may not display this or other websites correctly.
You should upgrade or use an alternative browser.
You should upgrade or use an alternative browser.
Wintry Machine Learning Mauler 1/30-2/1
- Thread starter SD
- Start date
Tsappfrog20
Member
Allan Huffman

Sent from my iPhone using Tapatalk

Sent from my iPhone using Tapatalk
SCURFS -

FFC put out a briefing to emergency management & media partners:

My forecast thoughts at the moment:


15z SREF snow mean (note the snow is still ongoing over much of the eastern half of the NC / S VA, and note this is 10:1 ratios):

FFC Discussion - https://mesonet.agron.iastate.edu/wx/afos/p.php?pil=AFDFFC&e=202601281943
Snippet
"Our major sticking points for the forecast will be the initiation of
precipitation and precipitation potential on the backside of the
surface low. Several model members, those which are trending slower,
bring more moisture in ahead of the system and generally lead to a
wetter first half. The models which move quicker end up developing a
stronger low which creates a more dynamic system leading to back-end
snow potential as the main hazard (though the initial push may
trigger snow showers in the mountains and isolated flurries
elsewhere). At this point, given the snow coverage across the TN
valley, the colder and faster solution seems to have the slight edge
in this situation. The result from this would be a quicker push of
cold air and the development of snow across the north side of the
surface low in northeast Georgia and western South Carolina. As the
system moves eastward/northeastward, strong northwest flow in the
low levels will drive wind gusts >30mph for much of the area.
Combining this with the 20:1 snow ratios and we could see some
"surprise" snowbands with isolated accumulations even in the dry
slot.
At this time the probability of at least 1" of snow in the ATL metro
sits between 10 and 40% with higher probabilities north and east.
This is likely an attempt to represent the patchy coverage with most
areas getting little to nothing and a lucky few receiving a good
quick snow."
wow
Member
even at 12 hrs, NAM is still pulling the lobe west

I’m typically in agreement with you on the ratios and not expecting them to be much more that 10:1. However I do think this one of the rare exceptions that up to 20:1 is real possibility back our way. I’m basing that on what I’m seeing in the forecast soundings with all models and smart mets that I respect like Webb and Brad P are talking about it as well.Just catching up on the models runs overnight, I like where CLT is for a nice several inch snow event. But I don't buy the crazy high numbers the gfs is spitting out, and I think ratios tend to be overdone. Generally speaking, I think qpf is too high on op models and like to go with the Euro EPS for it. Whatever it says, it's usually close to that. Right now, my guess is the ULL doesn't produce huge totals, the coastal really doesn't give 77 west that much precip if at all (it never seems to in my recollection), and the precip ends sooner than modeled every time west to east. Therefore right now, I'd expect around .3 inches or so from the ULL. So a 3-4 inch storm seems reasonable, and the best we've seen since 2018 I believe.
That drying is what you have to look for though out west. I think Raleigh area ends up better due to the coastal.

I appreciate the assist here bro
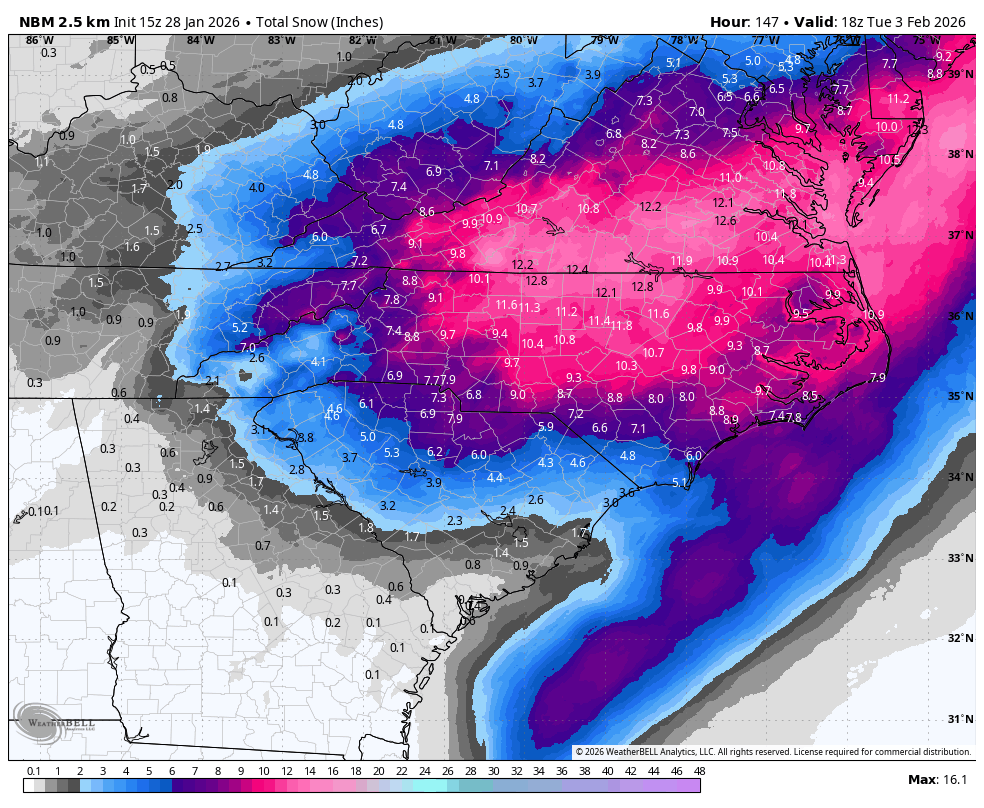
I have honestly never seen the NBM this high so widespread in the Carolinas. It’s interesting that Brad P often sights this in his video posts and forecastsNew National Blend of Models. It usually runs a cycle behind so we might see the totals trimmed a little for the next update.
CNCsnwfan1210
Member

I don’t think I saw it posted earlier, here’s the 12z Euro Kuchera
Sent from my iPhone using Tapatalk
Sctvman
Member
iGRXY
Member
This NAM run should be better. Thru Hour 30 you can see more separation starting
wow
Member
This NAM run should be better. Thru Hour 30 you can see more separation starting
It's a little further west than 12z Euro/GEM but not as much as the GFS
Bufkit has CLT with 27:1 ratios toward the later half of the storm 
iwantsouthernsnow123
Member
I'm not sure the last time, if ever I've seen FFC NWS say the snow ratios would be a 20:1 snow ratio
Webberweather53
Meteorologist
Is my first call map tomorrow evening really gonna have a 5-10/6-12” in it?! 
Certainly looks that way
Certainly looks that way
pulling inspiration from NWS local offices?Is my first call map tomorrow evening really gonna have a 5-10/6-12” in it?!
Certainly looks that way
wow
Member
The southern s/w is really popping on the NAM.. that's going to spin up our sfc low quicker and see the precip shield really blossom over AR/TN/NC
Snowking2.0
Member
@wow does far northern alabama have a chance with some of the precip?The southern s/w is really popping on the NAM.. that's going to spin up our sfc low quicker and see the precip shield really blossom over TN/NC/SC
@wow does far northern alabama have a chance with some of the precip?

Webberweather53
Meteorologist
pulling inspiration from NWS local offices?
You can check my previous winter storm forecasts over the last decade ish here if you are curious (& yeah I’ve had some clunkers along the way like all of us), but the most snow I have personally ever predicted in central-eastern NC is 5-10” right before the Jan 2018 storm. Just shows you how anomalous this event could be…
We certainly may challenge this forecast “record” of mine tomorrow evening!
https://www.webberweather.com/winter-storm-forecast-verification.html
The NAM still doesn’t look quite as good as the GFS or CMC but an improvement over 12z

I was just jesting a bit of course - but when an NWS office prints something like 3-10" range, I always chuckleYou can check my previous winter storm forecasts over the last decade ish here if you are curious (& yeah I’ve had some clunkers along the way like all of us), but the most snow I have personally ever predicted in central-eastern NC is 5-10” right before the Jan 2018 storm. Just shows you how anomalous this event could be…
We certainly may challenge this forecast “record” of mine tomorrow evening!
https://www.webberweather.com/winter-storm-forecast-verification.html
looking forward to your map on this storm!
Truly Murphy-to-Manteo. 100% of NC in accumulating snowfall. Same seems to be true for SC, which is even crazier!
I don’t think I saw it posted earlier, here’s the 12z Euro Kuchera
Sent from my iPhone using Tapatalk
also shows you how much we've sucked lolYou can check my previous winter storm forecasts over the last decade ish here if you are curious (& yeah I’ve had some clunkers along the way like all of us), but the most snow I have personally ever predicted in central-eastern NC is 5-10” right before the Jan 2018 storm. Just shows you how anomalous this event could be…
We certainly may challenge this forecast “record” of mine tomorrow evening!
https://www.webberweather.com/winter-storm-forecast-verification.html
NBAcentel
Member
RRFS going completely rogue with a 500mb presi not even close to consensus 
BrickTamland
Member
NAM at 57

TigerSnow
Member
Can someone explain what this means in simple terms for my future reference.RRFS going completely rogue with a 500mb presi not even close to consensus View attachment 190741
The Roofus looks like it would blank everyone except for a few snow showers. Love that. 
Cary_Snow95
Member
It is producing a look at 500mb very different from the entire modeling consensus. And not in a good wayCan someone explain what this means in simple terms for my future reference.
BrickTamland
Member
NAM has snow here a lot earlier. This would be 1 am Saturday.

Stormsfury
Member
It kept the upper feature in question closer to the 50/50 low and never detached off to have the lobe over Missouri/Western TN... thus no strong cutoff low.Can someone explain what this means in simple terms for my future reference.
iGRXY
Member
The colors on the east coast are drifting south meaning the trough is + tilted so there wouldn't be any lift. Basically we all end up cold and dry. Luckily this model is awful until about 24 hours out topsCan someone explain what this means in simple terms for my future reference.
TigerSnow
Member
I remember this in the last storm chase, we saw that on a few models and we were worried about qpf. Thanks for the explanation.The colors on the east coast are drifting south meaning the trough is + tilted so there wouldn't be any lift. Basically we all end up cold and dry. Luckily this model is awful until about 24 hours out tops
BrickTamland
Member
NAM at 69.
