CNCsnwfan1210
Member
This weekend and the tail end of next week (1/23-1/26) has my interest.
Sent from my iPhone using Tapatalk
Sent from my iPhone using Tapatalk
I was about to say. It looks like the precip is further back west, actually along the coast compared to the last several runs, and despite there being less consolidation of the energy the cold still appears to be there. It’s nothing out of the ordinary for precip to back west and northwest a couple hundred miles over 72-84 hours.To much of a bad thing might be a good thing? View attachment 182647View attachment 182646
I dont think that would bring snow if that trended NW.To much of a bad thing might be a good thing? View attachment 182647View attachment 182646
Yeah we still got time to get something this winterThis weekend and the tail end of next week (1/23-1/26) has my interest.
Sent from my iPhone using Tapatalk
It looks like the southern shortwave/vort is digging further SW. It’s almost becoming its own deal.I was about to say. It looks like the precip is further back west, actually along the coast compared to the last several runs, and despite there being less consolidation of the energy the cold still appears to be there. It’s nothing out of the ordinary for precip to back west and northwest a couple hundred miles over 72-84 hours.
the Cold we now have in place. Questions now are do we get a storm and how much NW trend come in too play?23 and frosty- feels like..January, finally.


Its going on the right direction for a hail Mary but the necessary changes still required are so significantTo much of a bad thing might be a good thing? View attachment 182647View attachment 182646
Last NOGAPS was in November. Yes, I lookedWhere's the JMA at currently for Sunday? Navy Nogaps, Korean Model lol

Not really you can even see by the contours that plenty of cold air is still there. If anyone doubts how much something like this can change this close in, I’ll remind you of the 1/21-22/2022 storm that pretty all models had nothing west of the immediate coast 36-48 hours before the storm came in.I dont think that would bring snow if that trended NW.
Because you need the ULL to link up

The snow last year had sc/nc dry that same timeframe 36hrs out and then we all saw snow.Not really you can even see by the contours that plenty of cold air is still there. If anyone doubts how much something like this can change this close in, I’ll remind you of the 1/24-25/2022 storm that pretty all models had nothing west of the immediate coast 36-48 hours before the storm came in.
I got basically nothing with thatNot really you can even see by the contours that plenty of cold air is still there. If anyone doubts how much something like this can change this close in, I’ll remind you of the 1/24-25/2022 storm that pretty all models had nothing west of the immediate coast 36-48 hours before the storm came in.

.png")
It was basically a south and east of I85 storm in NC. Also I think my dates might have been wrong. It was 1/21-/1/22I got basically nothing with that
This was posted and talked about at length when it was released 9 hours ago. Please check before posting maps. You've made several posts like this over the past few days that aren't timely. Thanks!00z ukmet is showing maybe something for the weekend.
View attachment 182655
Be nice if it (SS) got left behind and then #2 NS energy drop down in behind it. Be talking about a roof collapser for someone. Think Big!It looks like the southern shortwave/vort is digging further SW. It’s almost becoming its own deal.
What would you define as a roof collapserBe nice if it (SS) got left behind and then #2 NS energy drop down in behind it. Be talking about a roof collapser for someone. Think Big!


If they back away better look out we see 3" nowCJ ain’t buying. Ignoring last nights Ukie/Euro runs. Click bait Mets stepping aside. This gives us a chance to backdoor into something now.View attachment 182657
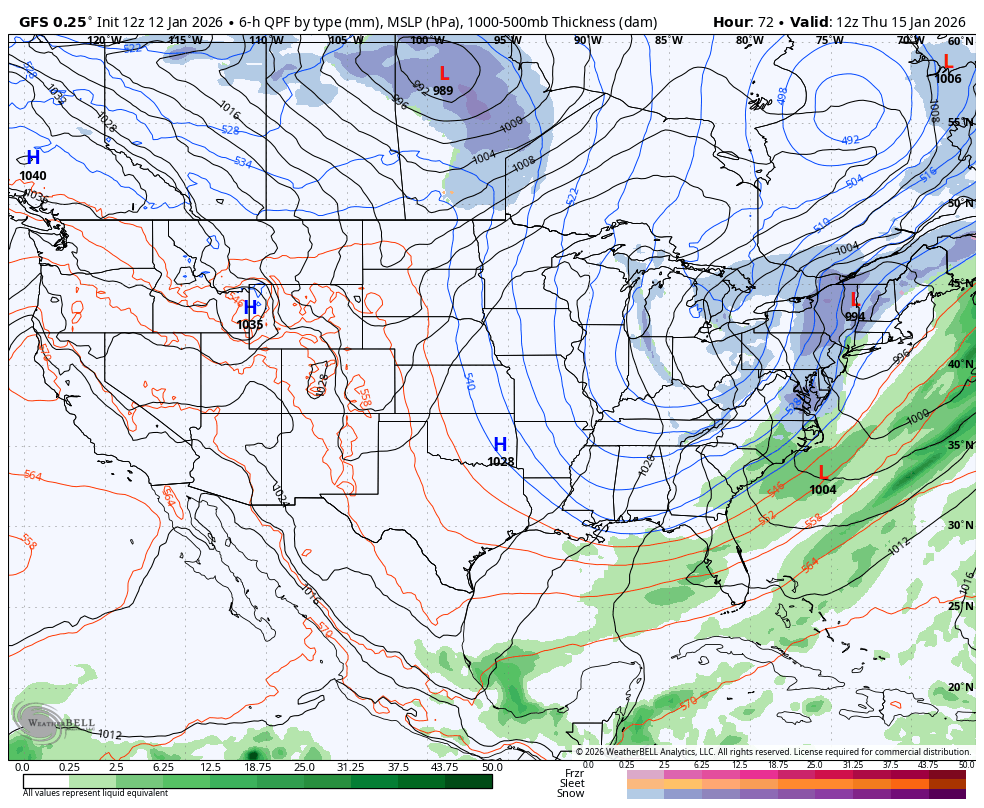
That has been the theme any time its been cold the past few years. Trough is too far east, western ridge is too far east.Big picture, the pattern this week unfortunately just has the trough/ridge too far east. It's been discussed, but in my opinion we want northern stream energy coming into the conus "down the stove pipe" of Idaho, digging south to TX, starting to tilt around the MS to give us a nice healthy storm. We're getting energy come in around the lakes, and Minnesota. That generally just leaves no time for proper spin up and won't work I don't think for the SE. No time for those vorts to dig and tilt to bring a storm. That's why everything is dry.
MA and NE is a different story and they may have some fun. Time is ticking, maybe the following week we'll get another chance. This week look nice and cold though so just a shame wasting this, swing and a miss.


Actually there was 8 members showing accumulating snow in SC by Sunday noon. I don't think that is a complete rejectionCJ ain’t buying. Ignoring last nights Ukie/Euro runs. Click bait Mets stepping aside. This gives us a chance to backdoor into something now.View attachment 182657


WeatherNation is a joke

BAMSDoes anybody know what weather model this is? Obviously not gonna happen like that, but genuinely intrigued looking at that.
 Much improvement here with moisture on the 12z icon.