• Hello, please take a minute to check out our awesome content, contributed by the wonderful members of our community. We hope you'll add your own thoughts and opinions by making a free account!

Pattern Jammin January 2023

1674777600-zbP85d43Xvk.png

This has crazy boom potential if we can get something to work in our favor for once.
 
I do like how the Pac ridging is going up east of Alaska more toward the Cali/Can coast at Day 10 on the Euro Op. Further east the better. The GFS suite keeps it a notch to far west from Hawaii up to Alaska. Probably transient anyway.


JB latest

Now thats a stratwarm. close to 45 C rise over the pole at 10 mb Similar situation in 2021, but displaced 2 weeks earlier. Current colder pattern is likely to back away feb 5-15 as we go back into the dreaded phase 4/5 MJO but reload after


Image


Image


11:39 AM · Jan 19, 2023·
13.7K
Views
 
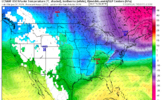
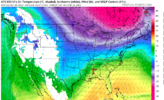
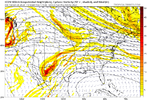
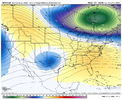
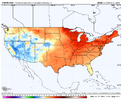
All this looks like is a quick trough before quick retrogression to a -PNA, nothing to get excited over really other than some colder/drier days and a hindrance to some warmer/better days. That Aleutian ridge isn’t doing anything for us. Really Nothing to get excited over on models other than some northern stream driven flurries, we lost that slighty better look (more SWLY flow which would have suggested overrunning). I snore 128BA442-3128-4ED6-81D5-2AAB97789820.png03FE2DE0-2507-4256-ABFC-D6B13278E744.png3FF7355F-287D-42E2-A178-C77C92080238.png
 
How do they determine what normal is when we spend 75% of the time AN?


Sent from my iPhone using Tapatalk
 
Last edited:
How do they determine what normal is when we spend 75% of that time AN?


Sent from my iPhone using Tapatalk
Normal (or average actually) temps are determined by an average of the past 3 decades of 10yr data sets. Currently using this span of time 1991-2020.

Think I have that correct but others here can confirm.
 
Back
Top