• Hello, please take a minute to check out our awesome content, contributed by the wonderful members of our community. We hope you'll add your own thoughts and opinions by making a free account!

Learning Global Warming facts and fiction

Status
Not open for further replies.
The following was written yesterday by the brilliant Don Sutherland. He is well-known by readers of AmericanWx like @BHS1975, who read this same post. There’s no need for me to add anything else as Don explains it very well with amazingly detailed backing data and relevant sources:
————————
“Last year, Phoenix experienced a historically hot summer. Although the extreme heat held off through May this year, a severe heatwave developed toward mid-June.
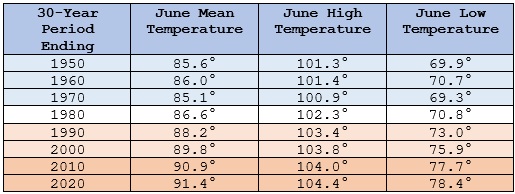
The June 2021 heatwave was among Phoenix's and Tucson's most severe June heatwaves and their most severe heatwave this early in the season. This heatwave developed as an extreme upper air ridge evolved during an era of rising June temperatures and an ongoing drought. An extreme heat event commenced at Tucson on June 11 and it commenced at Phoenix on June 13.
Such events are likely to become even more frequent in the years ahead. Anthropogenic warming is creating a growing likelihood of long-duration extreme events through more frequent wave resonance events (Kornhuber et al., 2016 and Mann et al., 2017).
Already, the frequency and intensity of compound summertime hot extremes (events that combine daytime and nighttime heat where such temperatures are above their 90th percentile for their calendar) has been increasing especially in geographic locations that include the U.S. Southwest (Wang 2020). The increase in forcing associated with anthropogenic greenhouse gases is the dominant driver of this outcome (Wang 2020).
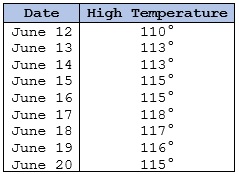
Table 1: Phoenix's High Temperatures during June 12-20, 2021
Phoenix-June-HW-2021-1.jpg
Table 2: Phoenix's Average June Temperatures (30-Year Moving Average)
PHXJune2021-2.jpg
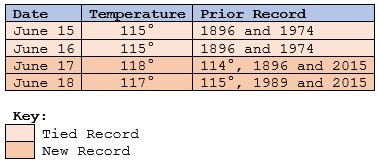
Table 3: Phoenix's Record High Maximum Temperatures
Phoenix-June-HW-2021-3.jpg
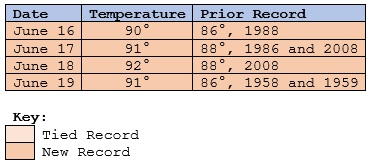
Table 4: Phoenix's Record High Minimum Temperatures
Phoenix-June-HW-2021-4.jpg
A portion of this heatwave qualified as the 8th Extreme Heat Event (EHE) on record for June, as at least 3 days saw the maximum , temperature exceed the 97.5th percentile (Phoenix: 115° or above; Tucson: 110° or above), the high temperature average exceeded the 97.5th percentile (Phoenix: 115° or above; Tucson: 110° or above), and all high temperatures exceeded the 81st percentile (Phoenix: 110° or above; Tucson: 105° or above) in June-August high temperatures for the 1971-2000 base period (Clarke, et al.,2014). The extreme heat event began on June 11 in Tucson and June 12 at Phoenix.
Table 5: Phoenix's Extreme Heat Events in June (1896-2021)
Phoenix-June-HW-2021-5.jpg
Additional Records:
Earliest 116° or above high temperature: June 17, 2021 (old record: June 19, 2016 and 2017)
Earliest 4 consecutive 115° days: June 15-18, 2021 (old record: June 19-22, 1968)
Most consecutive 115° days: 6, June 15-20, 2021 (old record: 4, June 19-22, 1968; June 25-28, 1979; June 25-28, 1990; July 26-29, 1995; July 28-31, 2020; and, August 16-19, 2020)
Earliest 4-day average high temperature of 115° or above: June 14-17, 2021 (old record: June 18-21, 2017)
Earliest 5-day average high temperature of 115° or above: June 14-18, 2021 (old record: June 17-21, 2017)
Earliest 6-day average high temperature of 115° or above: June 13-18, 2021 (old record: June 18-23, 2017)
Earliest 7-day average high temperature of 115° or above: June 13-19, 2021 (old record: June 18-24, 2017)
Earliest 8-day average high temperature of 115° or above: June 13-20, 2021 (old record: June 18-25, 2017)
Earliest mean temperature of 100° or above: June 15, 2021 (old record: June 17, 2008)
Earliest 2-day average mean temperature of 100° or above: June 15-16, 2021 (old record: June 17-18, 2008 and 2015)
Earliest 3-day average mean temperature of 100° or above: June 14-16, 2021 (old record: June 17-19, 2015)
Earliest 4-day average mean temperature of 100° or above: June 14-17, 2021 (old record: June 18-21, 2017).”
 
And here’s a followup from Don from a few hours ago addressing the June 2021 extreme heat:

“Ongoing climate change is driving an increase in Phoenix's temperatures. That increase is making hot synoptic patterns even hotter than they would otherwise be. In addition, one is witnessing a profound change in the ratio of hot days that exceed the 95th percentile for heat to cold days that exceed the 95th percentile for cold. The former is rising steadily. The latter has nearly disappeared (using 1971-90 percentile rankings).”
Phoenix-95th-Percentile-Days-1950-2020.j
 
Speaking of Phoenix I should post a picture of its station . There is a site from NOAA that gives you exact satellite locations of stations and tells you obstructions and station history . Phoenix station is probably one of the worst in the nation, it is quite literally next to jet black pavement . Not plain old runway asphalt but jet black pavement . Baltimore is the same way , and not surprisingly Baltimore reports unusually high temps .
 
There’s definitely UHI at play with Phoenix, especially driving that absolutely massive minimum temperature increase, though AGW is playing its role, no doubt, as well.
 
There’s definitely UHI at play with Phoenix, especially driving that absolutely massive minimum temperature increase, though AGW is playing its role, no doubt, as well.

I agree that it is a combo, with UHI contributing more to the higher minimums as you said and is why minimums have increased more quickly. Here is a good write up on Wikipedia:

https://en.m.wikipedia.org/wiki/Urban_heat_island

I know that Atlanta’s higher readings than the surrounding suburbs are almost entirely due to nighttime. Usually, afternoons in Atlanta are only a little, if at all, warmer than the suburbs. As the Wikipedia link says, this is mainly because daytime mixing/wind increases allow for a much more even distribution of heating. Related to this, nighttime lows on windy nights and on cloudy nights are often no more than a little warmer in Atlanta vs the suburbs. The UHI effect is most evident on clear, calm, and low dewpoint nights.

For this reason, in order to get the best feel for AGW’s effects independent of UHI, I focus more on daytime highs. Here again is what Don
posted about June “Extreme Heat Events” (EHEs) at Phoenix going back to 1896:

320C47E8-1BF3-4A79-B9D8-A6CBE2B174BC.jpeg

EHEs require 3+ days of 115+. The duration of an EHE is the number of consecutive days with 110+. Note that all have been since 1968 and 3 of the 8 have been only since 2013. The 3 longest durations by a good margin have all been since 1990. The largest number of 115+, 6, just occurred this month.

Though I think these Don posts are excellent, they would have been better if they had acknowledged the UHI effect on mainly nighttime lows. He should have mentioned that the warmer average lows are from a combo of UHI and AGW with perhaps more of it due to UHI. For the higher average highs, however, I think that a large majority has been due to AGW. Therefore, his post would have been better imo from an AGW standpoint if it had addressed only the highs, which he did focus more on to be fair to him.
 
When you are getting all time heat records getting shattered left and right and even a few cold records that's definitely a sign of an unstable climate.


Sent from my iPhone using Tapatalk
 
When you are getting all time heat records getting shattered left and right and even a few cold records that's definitely a sign of an unstable climate.


Sent from my iPhone using Tapatalk
Climate has never been stable , it’s not an air conditioned room where we can comfortably control a thermostat .
 
? ?. The problem is the people trying to control the climate. Damn. The earth warms and cools.

This. I don't think anyone would dispute the warming over the past several decades, but when something is being used for political gain, the extreme threats of it are probably not true. I want to see how much the climate has warmed near the equator.
 
We haven't been taking measurements of weather conditions for all that long in the scheme of history. For all we know we could be a lot cooler than we were a thousand years ago. I know scientists can predict what temperatures were like a thousand years ago but they can't even get it correct in a 90-day outlook much less hundreds of years in the past. Add in the political pressure on top of all the uncertainty and this is what you get.
 
This. I don't think anyone would dispute the warming over the past several decades, but when something is being used for political gain, the extreme threats of it are probably not true. I want to see how much the climate has warmed near the equator.

1. Good point about politics mixing in thus leading to intentionally overdoing the warming forecasts for political gain. AGW has been and will likely continue to be a pretty big deal but very likely nothing like the extreme threats suggest. And then as we go well into the future, I wonder about unmodeled negative global feedbacks that could very well arrest the GW before models suggest it, if not even reverse it at some point. The Earth is complex. Even before then I wonder about potential negative feedbacks like that from possible increased snowfall in places like Siberia. Who knows?

2. Equatorial warming is likely not nearly as much as compared to the big warmup in the Arctic, which results in less ice and thus lowered albedo meaning in theory a positive feedback resulting in even warmer Arctic temperatures. Then this results in even less ice and so on until some kind of negative feedback potentially kicks in.
Check out the incredibly strong Arctic warming, which at this site has been showing up for many years especially in met. fall and winter:


ArcticWarmth.png
 
Check out how warm 2020 was in the Arctic (typical of most recent years)...less ice/even more warming (positive feedback) due to lower albedo. Also, note how summer always ends up right at normal regardless of the earlier strong warmth:

ArcticWarmth2020.png
 
There’s definitely UHI at play with Phoenix, especially driving that absolutely massive minimum temperature increase, though AGW is playing its role, no doubt, as well.

I mentioned UHI to Don, especially regarding minimums, and he agreed:

"Yes, UHI has played an important role with the rising minimum temperatures. That’s why I suspect that minimum readings have increased faster than maximum ones."
 
Last edited:
2. Equatorial warming is likely not nearly as much as compared to the big warmup in the Arctic, which results in less ice and thus lowered albedo meaning in theory a positive feedback resulting in even warmer Arctic temperatures. Then this results in even less ice and so on until some kind of negative feedback potentially kicks in.
Check out the incredibly strong Arctic warming, which at this site has been showing up for many years especially in met. fall and winter:

I was thinking the same thing, though I haven't researched it much. Hasn't there been warm climate fossils found in the arctic to hypothesize that those regions have been warm or tropical in the past, or is that a theory from Pangaea or the result from a pole shift?
 
I was thinking the same thing, though I haven't researched it much. Hasn't there been warm climate fossils found in the arctic to hypothesize that those regions have been warm or tropical in the past, or is that a theory from Pangaea or the result from a pole shift?

I have read something similar about Greenland I think.
 
Check out how warm 2020 was in the Arctic (typical of most recent years)...less ice/even more warming (positive feedback) due to lower albedo. Also, note how summer always ends up right at normal regardless of the earlier strong warmth:

View attachment 85745
I assume the adiabatic process of melting icepack in the summer kind of puts a cap on the temperature up there? Though in a sufficiently warm world where the arctic ice camp melts away completely (or nearly so) every summer would see much warmer temperatures late summer since it wouldn’t be limited by this process, I presume.
 
There have been several papers lately that go opposite to what the MSM is constantly reporting about droughts, record highs, Hurricanes, Tornadoes and even snowfall which blows holes in the propaganda about AGW that the media proclaims. Climate change is real but it has always been real and will continue to be so. If you look at Paleo graphs of the Earths Climate, you will see this clearly in the historical reconstructions. the shrill claims about more hurricanes, more intense storms, more tornadoes, unprecedented droughts and heat waves are being looked at closely by real scientists interested in the data record and not a computer modeling scenario, see little if any trends to support the sky is falling proponents.
Look at the current Greenland graphs on ice gain/loss and you will see a surprising result which goes contrary to the meme that Greenland is melting and will flood the coastal cities, the AMO is going negative in the next five years so watch the rebound coming shortly after that of the Arctic Ice and Greenland ice sheet.1624639725687.png
I am not posting this to make any specious claim that a return of massive Ice mass gain is imminent, merely to show any snapshot in time of the weather is NOT a good indicator of long term Climate and means VERY little in the great scheme of centuries of Climate. We have heard from various "experts" that the Arctic would be ice free in 2009, 2010, 2011, 2012, 2013, 2014, 2105, 2016, 2017, 2018, 2019, 2020, 2021 and it is still here. Of course this was based on their "projections" based on Climate Models and the mysterious "feedback" mechanisms. Believe in Climate change being caused by SUV's all you want but I will just continue driving my Acura RDX and sleep soundly. BTW, anybody know what the CO2 levels were at their highest? Look it up, it will shock you
 
Early next week, Portland/Seattle/Eugene/Kamloops are forecasted to have highs that would be a whopping 11/10/10/9 above their June highs and 6/3/4/6 above their all-time highs!! Those aren't typos.

More from Don S. at AmericanWx today, this time about this upcoming historic Pacific NW heatwave:

"A heatwave of potentially unprecedented proportions for parts of the Pacific Northwest Region, including Oregon, Washington, and British Columbia is now in its early stages of evolving. June high temperature records will likely be shattered across much of the region. Numerous all-time high temperature records will likely be challenged or broken.

On Monday, the most populated region in the Pacific Northwest could see widespread temperature anomalies more than 4 standard deviations above the normal figures. A small part of the region could experience temperatures more than 6 standard deviations above normal.

Standardized Temperature Anomalies (6/28 18z):

1624641439020.png
Select June, All-Time Records, Forecast Maximum Temperatures:

1624641499885.png
Western sections of Oregon, Washington, and British Columbia, including Portland, Seattle, and Vancouver, will likely see the highest temperatures during the June 26-29 period. Elsewhere, exceptional warmth could persist into the opening days of July.

Minimum temperatures will also approach monthly and all-time lows, especially in areas affected by the Urban Heat Island (UHI) effect, namely Portland, Seattle, and Vancouver.

Climate change is increasing the frequency, magnitude, and duration of extreme heat events. One important mechanism is through wave resonance events (Mann et al., 2017). If one steps back to a larger hemispheric perspective starting near the beginning of June, one has witnessed the emergence of mega-heat domes in a "whack-a-mole" fashion in the Northern Plains, Southwest, and northern and eastern Europe (including northwestern Russia) that led to record heat, including some monthly or all-time record high temperatures. This latest heat dome is the fourth such major event this month."
 
Last edited:
Status
Not open for further replies.
Back
Top