snowlover91
Member
Now you're saying that I'm somehow completely degenerating your line of rationale or better yet "speak consensus to power" like I'm using the consensus as the main piece to my argument? Umm no, that's complete nonsense. I've been pretty kind and civil to you, trying to instill advice on you because I was at one point in your very shoes on this issue, referred you to pieces of literature and my own website even (which also has tons of literature attached to it) on the 19th & 20th century reconstructions, and correct me if I'm wrong but I'm very certain I've yet to mention "well "x" number of scientists say this" or anything even remotely related to that statement. At best, I was referring to how certain websites that are often heavily ridiculed by skeptics like yourself are run by actual climate scientists while WUWT, Real Science, & notrickszone are not (some of these esp the last one, are funded by fossil fuel corps btw who have a particular, subjective, non-scientific interest in spreading climate misinformation to the public and those who don't have the necessary training to refute or deeply delve into their arguments).
One can make a point without constantly approaching things with a “I know more than you attitude so I’m right and you’re wrong.” Read through your posts. It’s abundantly evident how you are approaching the discussion in this way. I’ve had discussions with AGW proponents who were able to make valid points without resorting to this type of behavior and it makes for a much more pleasant discussion. Having said that, the problem I have with a site like Skeptical Science is how they approach the issue with a preconceived view in mind and the goal of proving any skeptical line of reasoning as false or a myth. They often use the power of consensus argument or sometimes even cite only one or two sources to “prove” their point. Such an approach is no different than the skeptic sites you mentioned that often approach the subject of AGW in the same way except they are trying to disprove AGW.
The uncertainties in the data were at best glossed over and you're only now half-heartedly admitting they're size, but do you honestly think the uncertainities are small enough to where you can measure an actual signal in the data to claim the 1930s-40s was warmer or do you have any idea what the magnitude of the uncertainties are? That's all I really want to know. Instead you've chosen to side step this question or make very broadbrushed claims about the uncertainties without actually attempting to delve into them or produce literature that provided cold, hard numbers on these uncertainties.
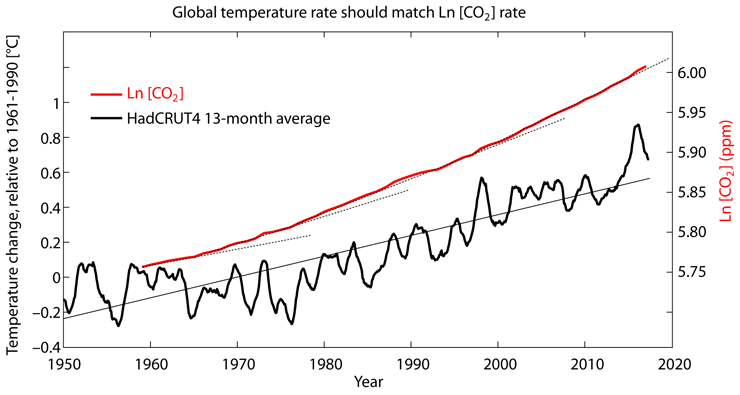
I’m sorry but my intent in this topic was never to get into the technicalities of data sets, their weaknesses and strengths, or other detailed aspects. I have a family to take care of and two kids, I don’t have a ton of time to sit down and discuss those in detail which is why I linked the article so those interested can do additional reading and determine in their own mind if the data is valid or not. Having said this, the one graph that I did link uses a weighted approach according to the surface area, “The HadCRUT4 data series has improved high latitude data coverage (compared to the HadCRUT3 series) the individual 5x5 grid cells has been weighted according to their surface area. This is in contrast to Gillet et al. 2008 which calculated a simple average, with no consideration to the surface area represented by the individual 5x5 grid cells.”
See below for additional info on this topic that might answer some of your concerns/questions.
Additionally, I don't think you actually understand what the HADCRUT4 data you were looking at shows. Remember that HADCRUT4 only produces values for grid boxes where there is data, and the average for many of those grid boxes where this is data, only constitute a couple stations (or even one!), if there's no data, it's excluded, which also means they're only measuring at best one-third of the arctic (even less before 1935), and what about the other two-thirds? We can't just ignore that. Also, what if those stations used in HADCRUT4 aren't equally spaced apart in the grid box or are better yet on the edge of the grid box in question, do you think they adequately represent the temperature variations at those points? Likely no. Berkeley, ERA-20C, ERA-20CM, GISS, and Cowtan/Way's interpolation w/ HADCRUT4 along with other datasets all agree this period wasn't as warm and was far more likely to be less warmer than it is today, if you want to dispute that, it's fine, publish your own peer reviewed study or rebuttal, I'd be glad to read it. The raw HADCRUT4 data doesn't really suffice to say the 1930s-40s were warmer than the 2000s because it's actually not even measuring the entirety of the arctic to begin w/.
The graph you posted is comparing the temperatures to 1981-2010 vs 1961-1990 in the graph I posted. I’m not sure how that alters things but it’s not an apples to apples comparison as you tried to indicate. I still believe there is ample data to indicate the warming seen in the 1920-45 time period is similar to what we saw leading into the early 2000s and isn’t much different than what we have currently (although things now might be somewhat warmer in the Arctic, depending on the data set and analysis used). Furthermore, I can offer some peer reviewed and scientific evidence that agrees with my “broad brush” conclusion, as you say.
First of all the IPCC had this to say in AR5 chapter 10.
“A question as recently as 6 years ago was whether the recent Arctic warming and sea ice loss was unique in the instrumental record and whether the observed trend would continue (Serreze et al., 2007). Arctic temperature anomalies in the 1930s were apparently as large as those in the 1990s and 2000s. There is still considerable discussion of the ultimate causes of the warm temperature anomalies that occurred in the Arctic in the 1920s and 1930s (Ahlmann, 1948; Veryard, 1963; Hegerl et al., 2007a, 2007b). The early 20th century warm period, while reflected in the hemispheric average air temperature record (Brohan et al., 2006), did not appear consistently in the mid-latitudes nor on the Pacific side of the Arctic (Johannessen et al., 2004; Wood and Overland, 2010). Polyakov et al. (2003) argued that the Arctic air temperature records reflected a natural cycle of about 50 to 80 years. However, many authors (Bengtsson et al., 2004; Grant et al., 2009; Wood and Overland, 2010; Brönnimann et al., 2012) instead link the 1930s temperatures to internal variability in the North Atlantic atmospheric and ocean circulation as a single episode that was sustained by ocean and sea ice processes in the Arctic and north Atlantic. The Arctic-wide increases of temperature in the last decade contrast with the episodic regional increases in the early 20th century, suggesting that it is unlikely that recent increases are due to the same primary climate process as the early 20th century.”
Polyakov et al. includes this in their abstract:
“In contrast to the global and hemispheric temperature, the maritime Arctic temperature was higher in the late 1930s through the early 1940s than in the 1990s.” http://www.personal.kent.edu/~jortiz/paleoceanography/warm_apr02.pdf

Yamanouchi had this to say and also referenced the Polyakov study
“It is known that a large warming event occurring from the 1920s to the 1940s in the Arctic, comparable to the recent 30-year warming, as observed in Fig. 3 by Polyakov et al., 2002, Polyakov et al., 2003a. The original objective of the former study was to confirm that the long-term surface air temperature (SAT) trends did not support the hypothesized polar amplification of global warming due to a large multidecadal variability; however, the authors did show that Arctic warming in the 1930s to the 1940s was exceptionally strong, reaching 1.7 °C, compared with the year 2000 maximum of 1.5 °C. Even though there was a global mean surface temperature rise from the 1920s to the 1940s, the actual increase was dominant mostly in the higher latitude.”
Then this which indicates this change was mostly in the Arctic region.
“The situation that a large temperature increase was mostly confined to high latitudes is most clearly indicated in Fig. 5 by Serreze and Francis (2006).” https://www.sciencedirect.com/science/article/pii/S1873965211000053#fig4

Sea ice extent from several studies https://www.tandfonline.com/doi/full/10.1080/02626667.2017.1324974
Figure 11. Comparison of our all-Arctic summer sea ice extent reconstruction with several other estimates in the literature: (a) Walsh dataset-derived summer extents; (b) Pirón and Pasalodos (2016) Alekseev et al. (2016) September extents; (d) CMIP5 modelled September extents; (e) our summer reconstruction.

Here was their analysis of the temperatures based on the GHCN dataset including stations north of 60N. The link above gives greater detail to their methodology.

Finally, here are some datasets for various Arctic locations from the GISS network that have long histories of reporting. The general trends can also be observed in these graphs which indicate all locations experienced a general warming in the 1920-1945 range that is close to or similar to what we see today. I certainly realize these are only 6 locations but they give a good indication of the overall trends these areas have seen historically. http://www.climate4you.com/Polar temperatures.htm#Arctic monthly surface air temperatures north of 70N

Wrt skeptical science and your other point, I'm aware of obvious errors and the lean of the website, but real scientists run them and they do focus on literature at hand instead of overused talking points that have little basis in science and more to do w/ geopolitics. Don't take this statement the wrong way or blow it out of proportion for what it really means, but the science is in fact settled and irrefutable that carbon dioxide, water, and methane, HCFCs, etc. are in fact greenhouse gases which by definition selectively absorb and emit outgoing longwave radiation at particular infrared wavelengths, warming the earth's surface. This has been proven well beyond any reasonable doubt in the laboratory and the field.
I agree completely and have not debated these ideas.
The part that's actually debated is how much these actually contribute to the warming of the climate and those who actually regularly published and are the most trained on the subject are far more likely to contend that it's a major player in the climate today and becoming a bigger player as time progress,
I agree as well that the effect of these is up for debate and that there are plenty of papers with various views on the matter. The bolded portion of your statement is leaning to a “consensus to power” line of reasoning, be careful.
those in the skeptical community have yet to prove beyond a reasonable doubt that the forcings are in fact not "major" from these GHGs, or a solid, alternative theory and instead tend to often resort to "one-dimensional" oversimplified arguments and line of rationale using correlations between natural oscillations and AGW for example as I delved into above, which is often their undoing and completely misleads them into thinking that "well the climate has changed to "x" before so it's warming now, therefore it's still mostly "x", " when in reality, like anything in mathematics or science, there are multiple ways to arrive at the same answer and conclusion, as there are multiple avenues to warm the climate, and what we're doing today simply isn't the same as any other point in earth's history and doesn't make the two comparable at least in that sense but in other ways they are similar of course.
I agree with most of the above, there is much we have to learn and uncover. What we are introducing into the atmosphere today with aerosols, fossil fuels, etc may be different and the studies on the effects of these are intriguing as well. However I will also add there are some interesting positions out there which attribute some or a large portion of the warming to various cycles or variability while also acknowledging that anthropogenic forcing has magnified these cycles/variances.
I'm not saying yourself and others in the skeptical community are completely inferior, lacking the necessary meteorological or climate science background and/or secondary education to delve into the subject, but they're very important to have and you can't deny that if you possessed this general suite of knowledge your opinion would significantly change. Sure, many have tried to train themselves extensively on the issue on their own time for leisure, etc (as I did for several years before going into college), but in the overwhelming majority (but not all) of cases, it's definitely not the same as actually following through at a distinguished institution.
There are plenty within the skeptical community who are well credentialed and incredibly knowledgeable. Whether you agree with their conclusions is irrelevant since your line of logic and reasoning here is based off of credentials and learning at a distinguished institution.
I just ask that you please stay on topic and stick with the discussion at hand on arctic 19th-20th century temperatures instead of trying to derail it and bring about a host of unrelated issues about so-called "groupthink" rationale, how politics are intertwined (which they definitely are) etc. because that's not what I'm actually concerned with nor what our previous dialogue was about. Those are certainly valid points of discussion for AGW in general, but I really would just like to stick to the actual science with climate change.
Since this thread is about AGW in general I have no problem with discussing the issues of “groupthink” rationale or other related issues that can affect data reliability and methodology. However, at this point my post is long enough and I will refrain from adding in data about that for the time being. That’s another discussion for another day.
Last edited:


")