• Hello, please take a minute to check out our awesome content, contributed by the wonderful members of our community. We hope you'll add your own thoughts and opinions by making a free account!

Learning Global Warming facts and fiction

Status
Not open for further replies.
You always going to have deniers even when the water is neck deep and the the ice caps are collapsing. Some folks just can’t see the forest for the trees.
 
When words like "Stupid" and "Deniers" are used, that's where the conversation tends to shut down. I hope that, especially on this awesome site, this is where the civil discourse doesn't spiral out of control. Thanks ;)

Well said, and I think there is sufficient reason for someone to say "hold the line" if someone suggests that humans are entirely responsible for a warming Earth, just as much as it is for someone to claim it isn't happening at all. Who's to say that what our current global temps are aren't the optimal temp? How do we know what the global temp SHOULD be? Small sample size is all we have (currently).
 
I completely agree. That said, I've been called worse than that and I hold two degrees in Atmospheric Science. Going against the herd isn't for the faint of heart.
Yes, when someone thinks they have a simple and only correct answer to a complex problem, name calling is usually their last resort when someone disagrees. I appreciate you willing to stand up for what your science and belief tells you 1300m, there are precious few willing to take the other side when the so called "consensus" (which is not how science is done anyway) tells them they are wrong and start to impugn their motive, intelligence or character. If we stacked up the incorrect predictions of the models and their adherents of the past 20 years to what has actually occurred, it would likely circle the entire earth. What a skeptic really means is a person who is still studying the scientific data against the predictions and trying to keep an open mind on what is causing any observed changes in our environment. Scientists who think they understand the incredible complexity of our atmosphere and how it works are dangerously delusional and should stick to observed verifiable facts instead of model output when making outlandishly incorrect predictions
 
Last edited:
You always going to have deniers even when the water is neck deep and the the ice caps are collapsing. Some folks just can’t see the forest for the trees.

You might want to read the info I posted above :) There are scientists out there who attribute the warming to other sources outside of man. Also, the climategate scandal revealed why you don’t hear much data to the contrary. Those who take natural causes as the reason for our warming are intentionally not published, blackmailed and called names. Real science always searches for every possible answer/explanation, agenda driven “science” follows the mainstream consensus and money trail. Look up climate-gate and you’ll see that pretty clearly.

Furthermore, there are hundreds of scientific papers that can be easily found which propose alternative means for the warming we’ve seen recently, outside of manmade causes. It’s also abundantly clear the scare tactics used have proven wrong time and time again. The polar bear population is stable. The Arctic and Antarctic both still have ice. Climate models have proven to be incredibly inaccurate in their predictions. Severe weather frequency has been on a downtrend in the US as has tropical activity. The list goes on and on with how wrong these climate experts have been. They try to scare people into doom and gloom and then are proven time and again to be completely wrong.

On another note, Greenland SMB is declining some with the recent blocking over that area but still is well above the 1981-2010 average.
upload_2018-8-11_18-49-12.png

Here is the gain/loss from September 2017 to now.
upload_2018-8-11_18-49-41.png
 

Attachments

  • upload_2018-8-11_18-49-3.png
    upload_2018-8-11_18-49-3.png
    87.4 KB · Views: 7
All I know, which can readily fit in a thimble and still allow room for mixer, is that yesterday a covey of mets at the NWS Jax progged a less than 10% chance of rain IMBY, and water was standing in the streets before nightfall ... go figure ...
 
Last edited:
You might want to read the info I posted above :) There are scientists out there who attribute the warming to other sources outside of man. Also, the climategate scandal revealed why you don’t hear much data to the contrary. Those who take natural causes as the reason for our warming are intentionally not published, blackmailed and called names. Real science always searches for every possible answer/explanation, agenda driven “science” follows the mainstream consensus and money trail. Look up climate-gate and you’ll see that pretty clearly.

Furthermore, there are hundreds of scientific papers that can be easily found which propose alternative means for the warming we’ve seen recently, outside of manmade causes. It’s also abundantly clear the scare tactics used have proven wrong time and time again. The polar bear population is stable. The Arctic and Antarctic both still have ice. Climate models have proven to be incredibly inaccurate in their predictions. Severe weather frequency has been on a downtrend in the US as has tropical activity. The list goes on and on with how wrong these climate experts have been. They try to scare people into doom and gloom and then are proven time and again to be completely wrong.

On another note, Greenland SMB is declining some with the recent blocking over that area but still is well above the 1981-2010 average.
View attachment 5594

Here is the gain/loss from September 2017 to now.
View attachment 5595

True Greenland ice loss was pretty normal but the rest of the sea ice is still taking a beating. The overall trend is still dropping fast. Once there is mostly open water in the Artic Sea during the melt season the Greenland Ice sheet loss will accelerate dramatically.

https://nsidc.org/arcticseaicenews/2018/08/ice-loss-speeds-up-during-second-half-of-july/


Sent from my iPhone using Tapatalk

Sea ice thickness is a much more telling tale. Things have stabilized the past 10 years and the thickness this year is comparable to 2014 and above the 2004-2013 average. To get a recovery in the Arctic you want thick ice and we are seeing that this year.
upload_2018-8-12_8-31-17.png
 
True Greenland ice loss was pretty normal but the rest of the sea ice is still taking a beating. The overall trend is still dropping fast. Once there is mostly open water in the Artic Sea during the melt season the Greenland Ice sheet loss will accelerate dramatically.

https://nsidc.org/arcticseaicenews/2018/08/ice-loss-speeds-up-during-second-half-of-july/


Sent from my iPhone using Tapatalk
You do know that the Arctic is only the Northern part (and much smaller in volume) of the globe and that there is an Antarctic also .Which btw just set an all time high for ice a couple of years ago and shows no downward trend since the satellite area began. It is no coincidence that the hemispheric ice areas tend to counter balance each other year to year, it is the Earth's way of keeping things climatologically stable. Could we be having some effect on the way it occurs? Possibly but the amount and signifigance of it is where the rub occurs
 
The problem is we are still playing it by ear instead of having control of our own climate which we may have eventually after the climate stabilizes.


Sent from my iPhone using Tapatalk
 
I agree.
The problem is we are still playing it by ear instead of having control of our own climate which we may have eventually after the climate stabilizes.


Sent from my iPhone using Tapatalk
I'm not sure what you are trying to get at. We can't just control the climate on our own. If we tried, on a global scale, the effects would likely have major consequences far worse than a slight warming of the atmosphere. We can't just stick a giant cooling system on the planet like you can put a fan or cooling system on a computer. Also, I'm not sure what will balance out the climate before any such thing could even be plausible. Sounds like a bunch of science fiction that can't happen for centuries. Unless you're suggesting some crazy idea or event that will curb the climate change which I don't exactly thing is good to consider. :confused:
 
You do know that the Arctic is only the Northern part (and much smaller in volume) of the globe and that there is an Antarctic also .Which btw just set an all time high for ice a couple of years ago and shows no downward trend since the satellite area began. It is no coincidence that the hemispheric ice areas tend to counter balance each other year to year, it is the Earth's way of keeping things climatologically stable. Could we be having some effect on the way it occurs? Possibly but the amount and signifigance of it is where the rub occurs
Not exactly true.. .there are several conflicting studies...
https://www.scientificamerican.com/article/what-to-believe-in-antarctica-rsquo-s-great-ice-debate/
https://phys.org/news/2018-03-antarctic-sea-ice-second-straight-year.html
 
I agree.

I'm not sure what you are trying to get at. We can't just control the climate on our own. If we tried, on a global scale, the effects would likely have major consequences far worse than a slight warming of the atmosphere. We can't just stick a giant cooling system on the planet like you can put a fan or cooling system on a computer. Also, I'm not sure what will balance out the climate before any such thing could even be plausible. Sounds like a bunch of science fiction that can't happen for centuries. Unless you're suggesting some crazy idea or event that will curb the climate change which I don't exactly thing is good to consider. :confused:

By controlling the amount of greenhouse gases in the atmosphere by planting trees and using other technologies to sequester carbon underground in a stable solid state (which is being tested now) or use it in manufacturing. I would think around 270 ppm CO2 should be good considering that’s where it’s been throughout most of civilization minus the last 100 years.


Sent from my iPhone using Tapatalk
 

The overall sea ice extent trend for the Antarctic is up over the past 30+ years. A warming ocean would shrink the ice extent (as we see in the Arctic) not cause it to grow.
Antarctic.JPG

Furthermore the data indicates temperatures in Antarctica are in fact cooling.
Oliva et al., 2017
http://www.sciencedirect.com/science/article/pii/S0048969716327152
“However, a recent analysis (Turner et al., 2016) has shown that the regionally stacked temperature record for the last three decades has shifted from a warming trend of 0.32 °C/decade during 1979–1997 to a cooling trend of −0.47 °C/decade during 1999–2014. … This recent cooling has already impacted the cryosphere in the northern AP [Antarctic Peninsula], including slow-down of glacier recession, a shift to surface mass gains of the peripheral glacier and a thinning of the active layer of permafrost in northern AP islands.”

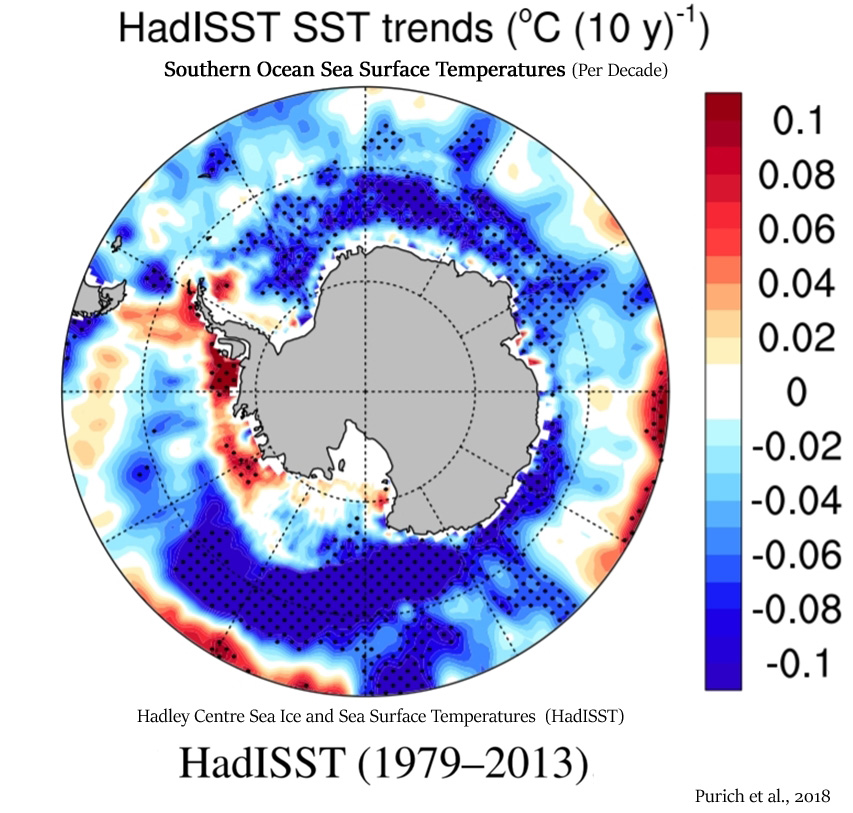
Here are Antarctic SST anomaly trends from 1979-2013, barely any warming and substantial cooling.
Southern-Ocean-Cooling-1979-to-2013-Purich-2018.jpg


From that same study, it's clear that climate models have completely missed this change. How can we trust them when they are so wrong and missing the real-time changes and observations?
Purich et al., 2018
“Observed Southern Ocean changes over recent decades include a surface freshening (Durack and Wijffels 2010; Durack et al. 2012; de Lavergne et al. 2014), surface cooling (Fan et al. 2014; Marshall et al. 2014; Armour et al. 2016; Purich et al. 2016a) and circumpolar increase in Antarctic sea ice (Cavalieri and Parkinson 2008; Comiso and Nishio 2008; Parkinson and Cavalieri 2012). … [A]s high-latitude surface freshening is associated with surface cooling and a sea ice increase, this may be another factor contributing to the CMIP5 models excessive Southern Ocean surface warming contrasting the observed surface cooling (Marshall et al. 2014; Purich et al. 2016a), and sea ice decline contrasting the observed increases (Mahlstein et al. 2013; Polvani and Smith 2013; Swart and Fyfe 2013; Turner et al. 2013; Zunz et al. 2013; Gagne et al. 2015) over recent decades. … Our results suggest that recent multi-decadal trends in large-scale surface salinity over the Southern Ocean have played a role in the observed surface cooling seen in this region. … The majority of CMIP5 models do not simulate a surface cooling and increase in sea ice (Fig. 8b), as seen in observations.”


Looking at the Arctic, people love to show the 1979-present graph from PIOMAS that shows a clear downward trend in ice extent.
BPIOMASIceVolumeAnomalyCurrentV2.1.png


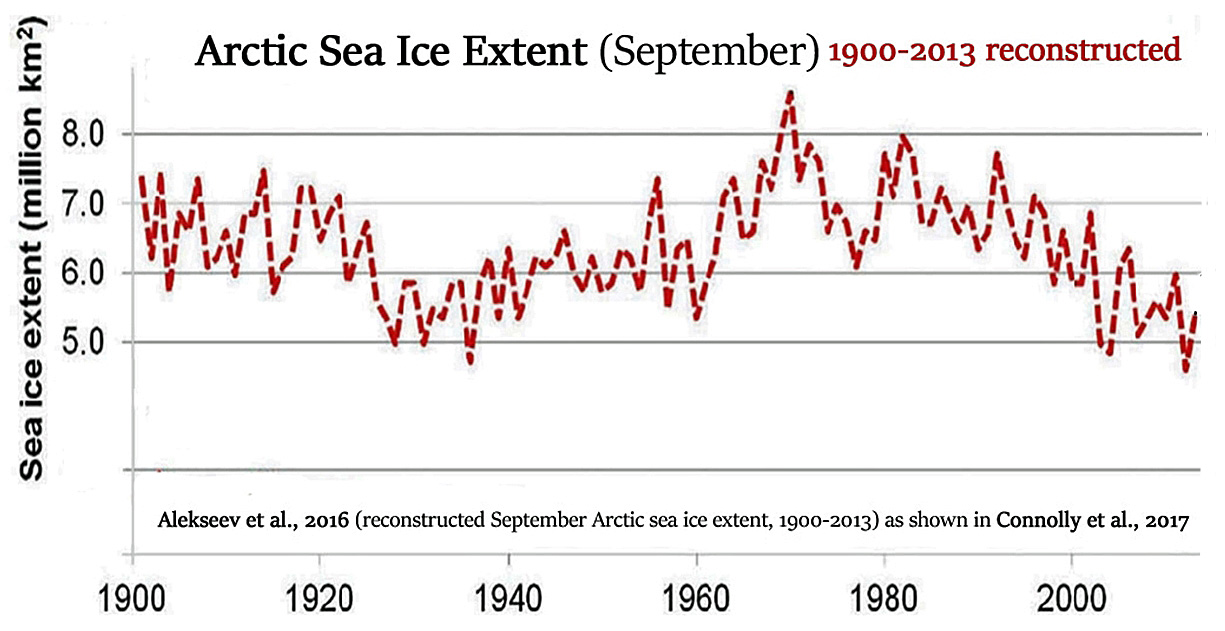
What they like to ignore is the longer term cyclic nature of the Arctic. Reconstructions over say 100 years indicate the levels we see now are not unheard of; they were seen in the 1920-1940 period before a gradual recovery. Reconstructions and other data indicate the Arctic and Antarctic have natural cycles lasting several decades (and even longer) and is within normal natural variability.
Arctic-Sea-Ice-Extent-1900-2013-Alekseev-2015-Connolly-2017.jpg


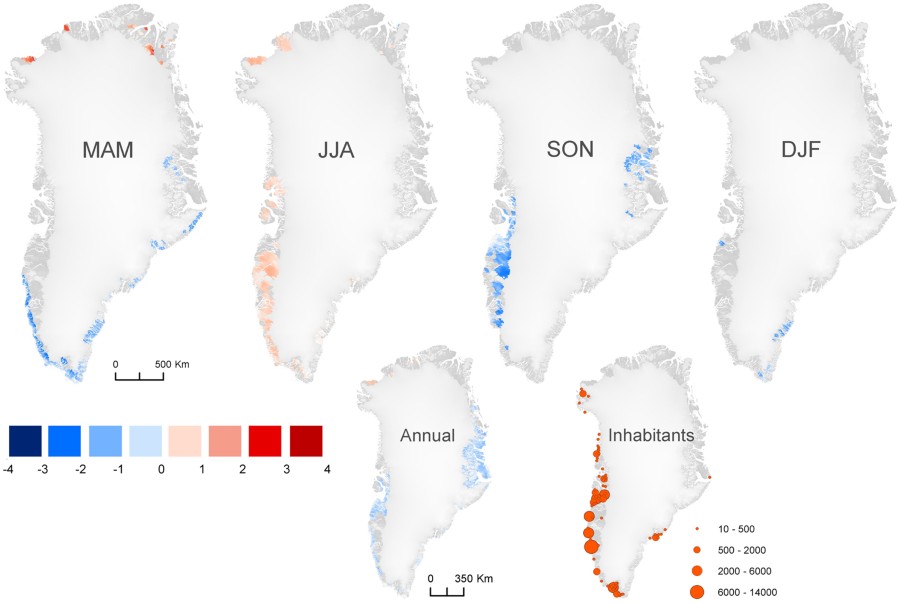
It's no coincidence that recent data indicates that not only is Greenland seeing increased SMB gain in recent years, it is also beginning to see a cooling trend.
Westergaard-Nielsen et al., 2018
“Here we quantify trends in satellite-derived land surface temperatures and modeled air temperatures, validated against observations, across the entire ice-free Greenland. … Warming trends observed from 1986–2016 across the ice-free Greenland is mainly related to warming in the 1990’s. The most recent and detailed trends based on MODIS (2001–2015) shows contrasting trends across Greenland, and if any general trend it is mostly a cooling. The MODIS dataset provides a unique detailed picture of spatio temporally distributed changes during the last 15 years. … Figure 3 shows that on an annual basis, less than 36% of the ice-free Greenland has experienced a significant trend and, if any, a cooling is observed during the last 15 years (<0.15 °C change per year).”
41598_2018_19992_Fig3_HTML.jpg
 
Thanks snowlover, you beat me to it ;)
No problem! What interests me most is how proponents of AGW must constantly twist the data analysis or come up with new ways to analyze data when it causes problems for the AGW theory.

NASA 2015: The Antarctic is gaining ice and cooling
AGW response: The data must be wrong, comes up with new theories to explain how it really is still losing ice and warming OR says the sudden cooling and ice gain is a result of a process that takes thousands of years to occur and is offsetting AGW.

Cyclic theories in the AGW paradigm are only used when it can further promote their belief system as in the example above, otherwise they throw out these cycles and look at only 20-40 years of observational data to make conclusions with the assumption that the rise in CO2 and warming must be man-made and there is no alternative explanation.

As I have posted on the past few pages, there is PLENTY of research out there which advocates for alternative views on what may be causing the warming. The reason people don't hear about them is due to the shift by the news media, social media (see YouTube recent developments on AGW) and other sources to promote AGW and blacklist/bury any alternative scientists and viewpoints. This is anti-science and embarrassing, really, to see this type of suppression going on. Here's a brief summary that was written after some additional emails were released in 2011.
(1) prominent scientists central to the global warming debate are taking measures to conceal rather than disseminate underlying data and discussions; (2) these scientists view global warming as a political “cause” rather than a balanced scientific inquiry and (3) many of these scientists frankly admit to each other that much of the science is weak and dependent on deliberate manipulation of facts and data.
https://www.forbes.com/sites/jamest...-rock-the-global-warming-debate/#3965605627ba
 
Looking at the Arctic, people love to show the 1979-present graph from PIOMAS that shows a clear downward trend in ice extent.
BPIOMASIceVolumeAnomalyCurrentV2.1.png


What they like to ignore is the longer term cyclic nature of the Arctic. Reconstructions over say 100 years indicate the levels we see now are not unheard of; they were seen in the 1920-1940 period before a gradual recovery. Reconstructions and other data indicate the Arctic and Antarctic have natural cycles lasting several decades (and even longer) and is within normal natural variability.
Arctic-Sea-Ice-Extent-1900-2013-Alekseev-2015-Connolly-2017.jpg


It's no coincidence that recent data indicates that not only is Greenland seeing increased SMB gain in recent years, it is also beginning to see a cooling trend.

41598_2018_19992_Fig3_HTML.jpg

Nice post that suggests that looking at only 1979+ in the Arctic is sort of cherry picking from a relatively high starting point. This makes me wonder, myself. There’s no question that the Arctic has warmed substantially since 1979 (though not at all in late spring and summer) and has in recent years had the largest warm anomalies in met. autumn and winter per the charts I constantly follow. But if they had been available back to 1900, what would these have shown in the other supposedly quite warm period of 1920-1940? If they were to look similarly warm to recent years, it might be “game over” for the GW alarmists. Is there any way to obtain credible Arctic SST anomalies from 1920-1940?

Regardless, I do need to ask whether or not the 1979+ map being “volume” and the 1900+ map being “extent” means too much of an apples to oranges comparison. In other words, could a 1900+ “volume” chart have looked much different from this 1900+ “extent” chart?
 
Last edited:
Nice post that suggests that looking at only 1979+ in the Arctic is sort of cherry picking from a relatively high starting point. This makes me wonder, myself. There’s no question that the Arctic has warmed substantially since 1979 (though not at all in late spring and summer) and has in recent years had the largest warm anomalies in met. autumn and winter per the charts I constantly follow. But if they had been available back to 1900, what would these have shown in the other supposedly quite warm period of 1920-1940? If they were to look similarly warm to recent years, it might be “game over” for the GW alarmists. Is there any way to obtain credible Arctic SST anomalies from 1920-1940?

Regardless, I do need to ask whether or not the 1979+ map being “volume” and the 1900+ map being “extent” means too much of an apples to oranges comparison. In other words, could a 1900+ “volume” chart have looked much different from this 1900+ “extent” chart?

When you look at the extent graphs, they show a similar result. Here is July extent trend (early September is typically the lowest point) from 1979 to 2018.
Figure3.png


Now compare with this chart which is based off September extent (lowest point for the Arctic typically). The ice extent trends are similar and show that the levels we see now are not unheard of and were experienced in the 1920-1940 period of time when CO2 was at much lower levels vs today.
Arctic-Sea-Ice-Extent-1900-2013-Alekseev-2015-Connolly-2017.jpg

Thanks. So, when looking at “extent” graphs for both periods (apples to apples), they, indeed, do match up well. However, I still wonder if “volume” was as low as it is now during 1920-40. Isn’t volume arguably the most important variable?
 
I constantly follow fantastic daily Arctic temperature anomaly charts found here (1958-present!!):

http://ocean.dmi.dk/arctic/meant80n.uk.php

It wouldn’t take long for one to look at all 60 years. If one did that, he/she would find that 1958-1979 was substantially colder than 1997+ during autumn and winter. What’s extra interesting is that 2005+ look so consistently very warm during fall/winter. It is almost as if someone flipped an extra warm switch in 2005! Then focus on 2016-18 and look at how ridiculously warm those have been during fall/winter.

Edit: note how summers always cool to near normal!

Now, if I could only be able to see similar charts for 1920-40! Would they also show these similar ridiculously warm anomalies to 2005+??
 
Last edited:
Status
Not open for further replies.
Back
Top